
With the present market overwhelmingly bearish, many major altcoins seemed to be struggling to hold their high valuations on the charts as a series of corrections ensued. While the decline has remained minimal over the last 24-hours, the charts of a few crypto-assets seemed to suggest that further downtrend movement could follow in the coming days.
Cardano [ADA]

Source: ADA/USD on TradingView
11th-ranked Cardano’s decline has been evident since the start of August, in spite of the early bullish trend on the charts. Over the last few days, the crypto-asset registered an ascending channel pattern, one that noted a bearish breakout a few hours back. The price, at the time of writing, was nursing -0.59 percent in returns over the past 24-hours as its market cap remained around $2.91 billion.
With a trading volume of $336 million over the last 24-hours, the Awesome Oscillator for the token was still suggestive of a bearish pullback. With the histogram’s red signals becoming less defined, the momentum was weak, but bearish for all reasons. Further, the Relative Strength Index or RSI came to a similar conclusion, picturing high selling pressure in the market.
Cardano’s credibility was recently questioned by Bitcoin Maximalists, with Adam Back calling out ADA tokens and Charles Hoskinson, labeling the former as the best shitcoin.
VeChain [VET]
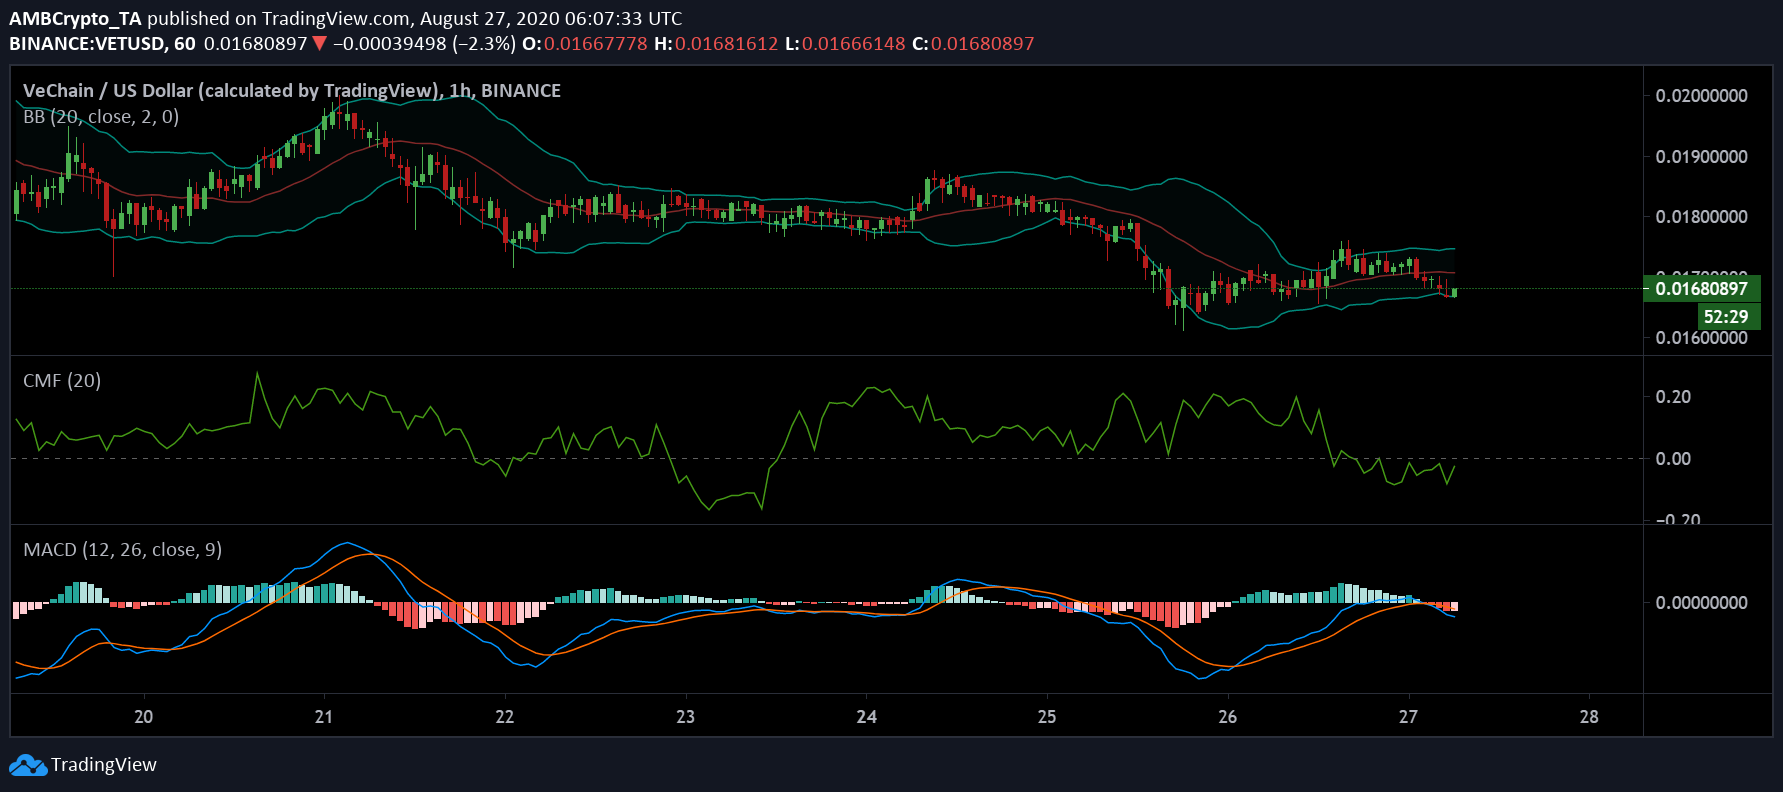
Source: VET/USD on TradingView
For VET tokens, the Chaikin Money Flow suggested that the capital inflows were on the edge of getting outdone by capital outflows, but over the past 24-hours, its valuation had improved by 0.09%. VET had a market cap of $937 million at the time of press, with a below-average trading volume of $133 million.
Further, the Bollinger Bands appeared to be diverging a little on the charts so, volatility could be potentially higher going forward but the opposite could happen as well.
Finally, the MACD line continued to hover below the signal line, suggestive of the current bearish trend.
DASH

Source: DASH/USD on Trading View
For DASH, the situation was still uncertain as in spite of being under bearish pressure, the crypto continued to register sharp pullbacks. The major trend barrier for the token has been the overhead resistance developed by the 50-Exponential Moving Average (blue line) over the past week. DASH’s price has continuously bounced below that after undergoing a minor breach with the EMA.
With the Parabolic SAR bearish due to the dotted markers hovering over the candlesticks, the Relative Strength Index or RSI may possibly register a little bit of buying pressure over the next few days.
DASH had a market cap of $826 million at the time of writing, and it was priced at $85.