DASH, IOTA, Chainlink Price Analysis: 4 September

For all the talk about an altseason, Bitcoin, the world’s largest cryptocurrency, continues to share high correlation stats with the rest of the market’s altcoins. This was very apparent over the last 72-hours as the larger crypto-market bled following Bitcoin’s incredible depreciation on the charts. The likes of Chainlink, IOTA, and DASH were among them, with each of these cryptos failing to hold on to highs sustained just a few weeks ago.
Chainlink [LINK]

Source: LINK/USD on TradingView
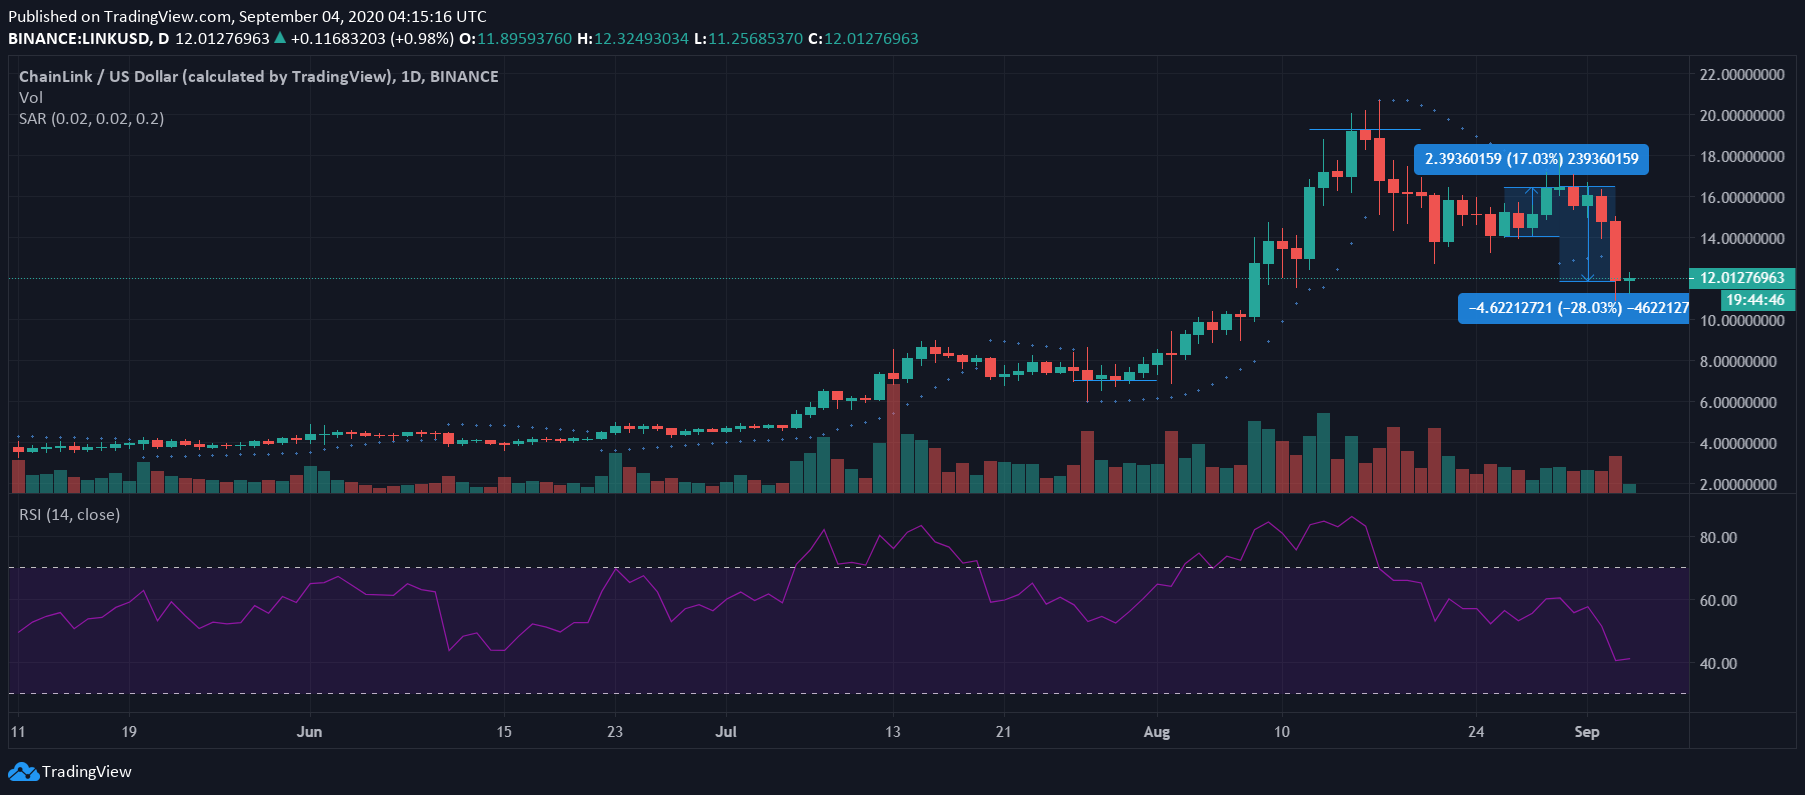
Chainlink, the cryptocurrency ranked 6th on CoinMarketCap’s rankings, has been one of the market’s best-performing assets over the course of 2020. In fact, at the time of writing, LINK was registering YTD returns of just over 564%. However, the crypto-assets performance was in the shadows of Bitcoin’s fall on the charts, with LINK falling by almost 30% over the past 4 days. Incidentally, the fall in question came on the back of a 17% surge in the crypto’s price.
At the time of writing, LINK was trading at $12.01, well away from its resistance level and its recently-claimed ATH on the price charts.
Interestingly, despite the scale of the fall, LINK’s indicators weren’t exactly on the same page. While most of the Parabolic SAR’s recent dotted markers were under the price candles (except the last one), the Relative Strength Index could be seen plunging towards the oversold zone on the charts.
Chainlink was in the news recently after a Santiment weekly report revealed that 70% of LINK’s supply was held by 9 addresses alone.
IOTA

Source: IOTA/USD on TradingView
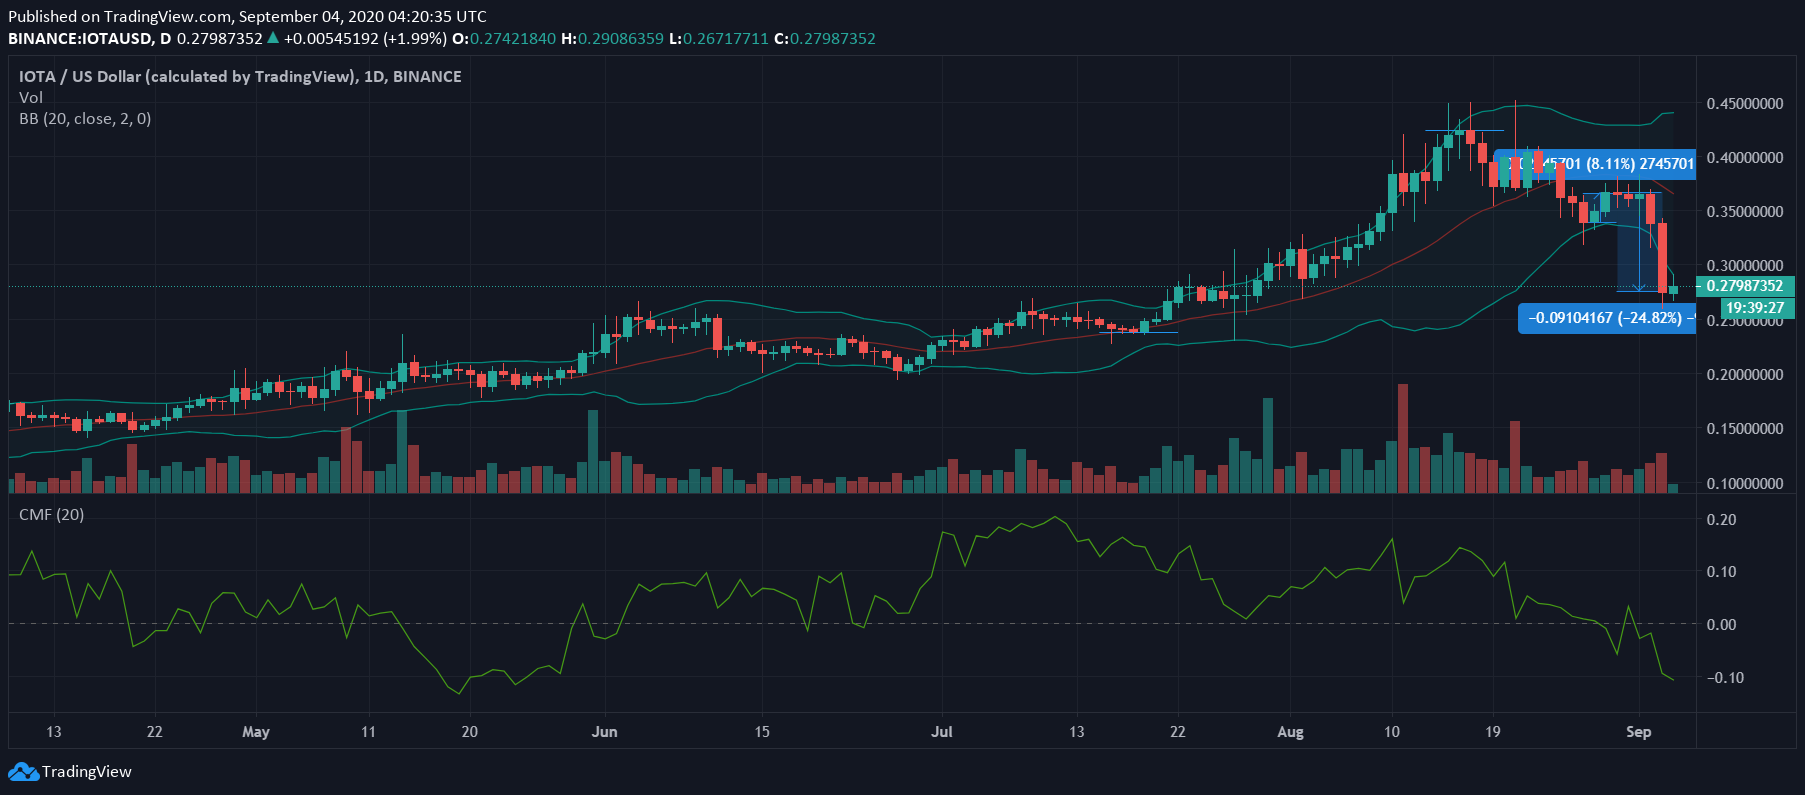
IOTA, the 26th-ranked cryptocurrency on CoinMarketCap, aped the movements of Bitcoin, and by extension, the larger crypto-market. Like Chainlink, IOTA too fell dramatically on the charts, with the crypto down by almost 35% over the last 72-hours. In fact, its latest depreciation came on the back an 8% hike in the crypto’s value. Following the same, IOTA, at the time of writing, was trading at its February 2020 levels.
It should be noted, however, that well before the latest fall, in mid-August, the crypto was trading at its July 2019 price levels.
While the mouth of the Bollinger Bands was wide and underlined the growing volatility in the price market, the Chaikin Money Flow was noted to be falling steeply towards -0.10, a sign of greater capital outflows than inflows.
According to Gulf International Bank’s Frank Schwab, Deutsche Bank’s Stefan Hoops reportedly revealed recently that the MNC is studying and assessing IOTA.
DASH

Source: DASH/USD on TradingView
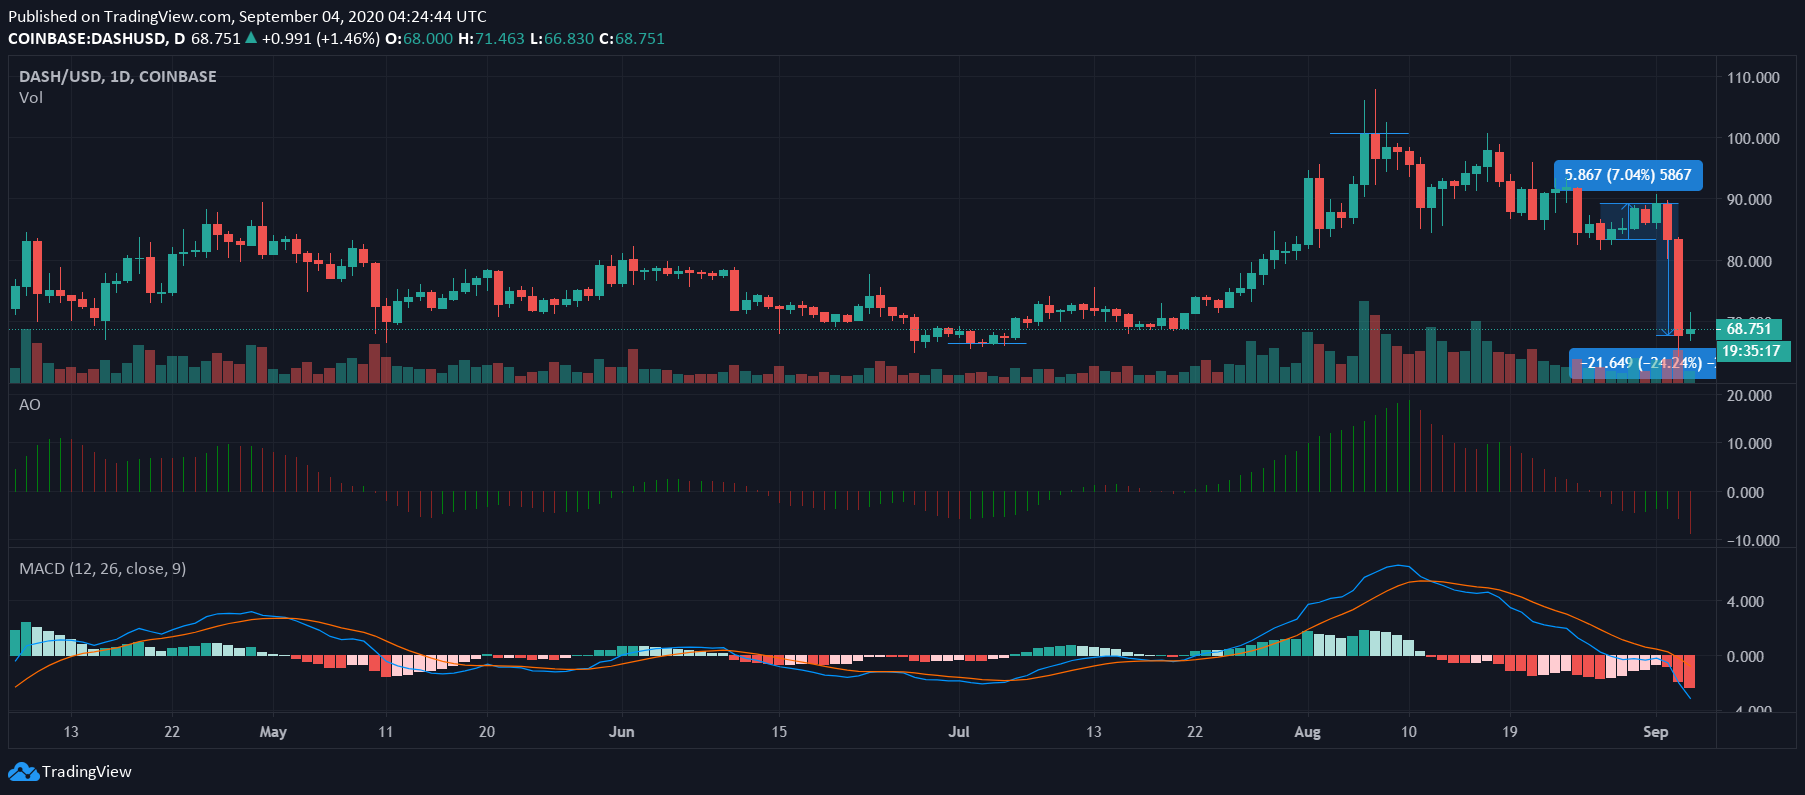
DASH, one of the market’s foremost privacy coins, has been noting topsy-turvy movement on its charts over the past few months. Since hitting a local peak in the first week of August, however, DASH has steadily depreciated on the charts. In fact, the same was made worse by Bitcoin’s own fall, with the crypto down by almost 25% in the last few days.
While the Awesome Oscillator pictured minimal market momentum, the MACD line was falling sharply under the Signal line on the charts.


