
- Whale activity around LINK surged during its bull rally.
- Liquidation increased, and market indicators turned bearish on LINK.
Chainlink [LINK] gained bullish momentum last month as its price rallied substantially. The recent uptrend allowed the majority of investors to earn profit, which was evident from a look at the latest data. However, the bull rally seems to have come to an end as LINK’s daily chart turned red.
A quick look at Chainlink’s rally
A check of CoinMarketCap’s data revealed that the token’s price surged by more than 95% over the last 30 days. This price uptrend also changed quite a few key stats.
IntoTheBlock recently posted a tweet highlighting the blockchain’s performance during its bull rally. During the bear market, more than 70% of holders were holding at a loss for more than one year.
However, things changed thanks to the bull rally, as it allowed the majority of investors to be in profit.
Chainlink has been one of the top performers of the recent bullish momentum and many have high expectations. Let’s take a look at some key on-chain metrics for $LINK
Holder Profit Analysis
?56% of $LINK holders are in profit are currently in profit.
?This is in the same range… pic.twitter.com/vSxmehr8zH— IntoTheBlock (@intotheblock) November 14, 2023
While Chainlink’s price rallied, daily transactions increased by 436% from the monthly low. A surge in on-chain transaction volume was also noted, as it reached a daily volume of $515 million just last week.
Not only that, but whale activity around the token has also increased.
According to the tweet, holders with more than 1% of the supply accumulated 52,450,813 LINK in the past 30 days.
The bears are buckling up
After a month, the good days seem to have ended as Chainlink’s daily chart turned red. The token’s price dropped by more than 2% in the last 24 hours, along with a slight increase in its trading volume.
At the time of writing, LINK was trading at $14.41 with a market capitalization of over $8 billion, making it the 12th largest crypto.
A possible reason for this price drop could be high liquidation. As per Hybock Capital’s data, LINK’s liquidation peaked while its price was near the $16 mark.
After that, the token’s price dropped and has not managed to rise above that resistance level.
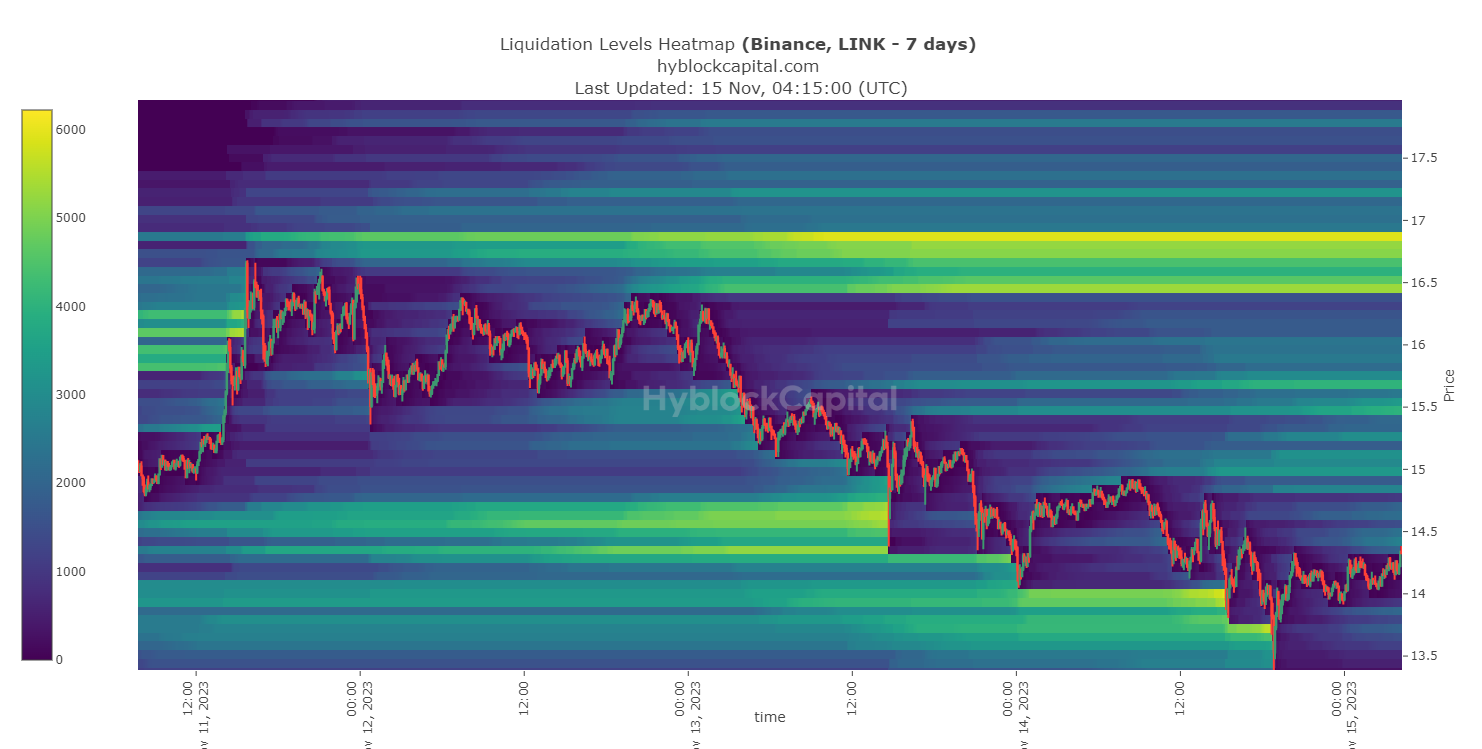
Source: Hyblock Capital
AMBCrypto’s analysis found that selling pressure on LINK increased. This was evident from the fact that LINK’s net deposit on exchanges was higher compared to the last seven-day average. Additionally, its active addresses and transfer volume have also declined of late.
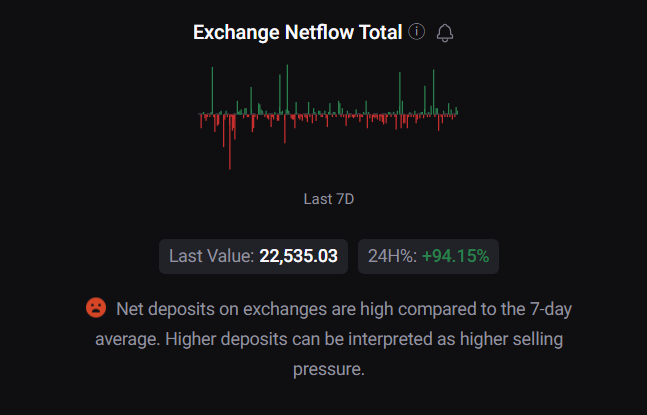
Source: CryptoQuant
Read Chainlink’s [LINK] Price Prediction 2023-24
AMBCrypto analyzed LINK’s daily chart to see what to expect from it in the days to follow. As per the analysis, LINK’s MACD displayed a bearish crossover.
Its Money Flow Index was also about to enter the overbought zone, which can exert more selling pressure on the token. Chainlink’s Chaikin Money Flow remained ambiguous as it took a sideways path above the neutral mark.

Source: TradingView