
- Buyer exhaustion appeared around $15.27, propelling a notable correction in the last 24 hours
- Exchange inflow surpassed the outflow, suggesting that LINK may continue to fall.
Holding Chainlink [LINK] over the last few months is one of the best decisions any market participant must have made in this cycle. For a market that began the year on a torrid note, LINK’s 108% jump in the last 90 days could be a sign that the bear phase was in its last stages.
But in the last 24 hours, the token has shredded 5.08% of its gains as it dropped to $15.36. This drawdown led Ali Martinez to post that further correction could be on the way.
Martinez, a crypto analyst and trader, noted that the Tom DeMark (TD) Sequential indicated that LINK may drop to $12.50.
It looks like #Chainlink is bound for a correction!
The TD Sequential presented a sell signal on $LINK daily, 3-day, and weekly charts, anticipating a retracement toward $12.50. Failing to hold above this critical support area could extend the losses to $10.50.
Looking to buy… pic.twitter.com/jzk92ZFu25
— Ali (@ali_charts) November 13, 2023
Time for LINK to cool down
The TD Sequential is a technical tool designed to identify points of exhaustion and potential price reversal. From the chart Martinez shared, buyers already seemed fatigued at $15.27. This, therefore, implies that a lot of market players are taking profits earned from the last few months.
Martinez also added that if the selling pressure continues, LINK may drop to $10.50 which is a critical support area. But before LINK’s retracement, there has been talk in some corners that the token could surpass its All-Time High (ATH).
LINK’s ATH was $52.70 at press time. Meanwhile, Glassnode’s data, analyzed by AMBCrypto, showed that the token was still 86.99% down from the peak.
![Chainlink [LINK] price performance from its All-Time High](https://eng.ambcrypto.com/wp-content/uploads/2023/11/glassnode-studio_chainlink-price-drawdown-from-ath.png)
Source: Glassnode
The RSI reading implied that LINK’s buying momentum was waning. So, the token value may continue to decrease.
Meanwhile, a look at the 0.786 Fibonacci retracement level showed that there could be an entry around $11.82 should LINK drop below $12. If, at $11.82, buying pressure intensifies, then a recovery to $15 may be plausible.

Source: TradingView
Buyers are now spectators
On looking at the exchange activity, AMBCrypto found out from Santiment’s data that LINK’s Exchange Inflow had outpaced the outflow. Exchange Inflow tracks the number of tokens moving from external wallets into exchange addresses.
Is your portfolio green? Check out the LINK Profit Calculator
On the other hand, Exchange Outflow is the number of tokens moving from exchanges to self-custody. If the outflow outweighs the inflow, the effect on the price action may either be consolidation or an uptick.
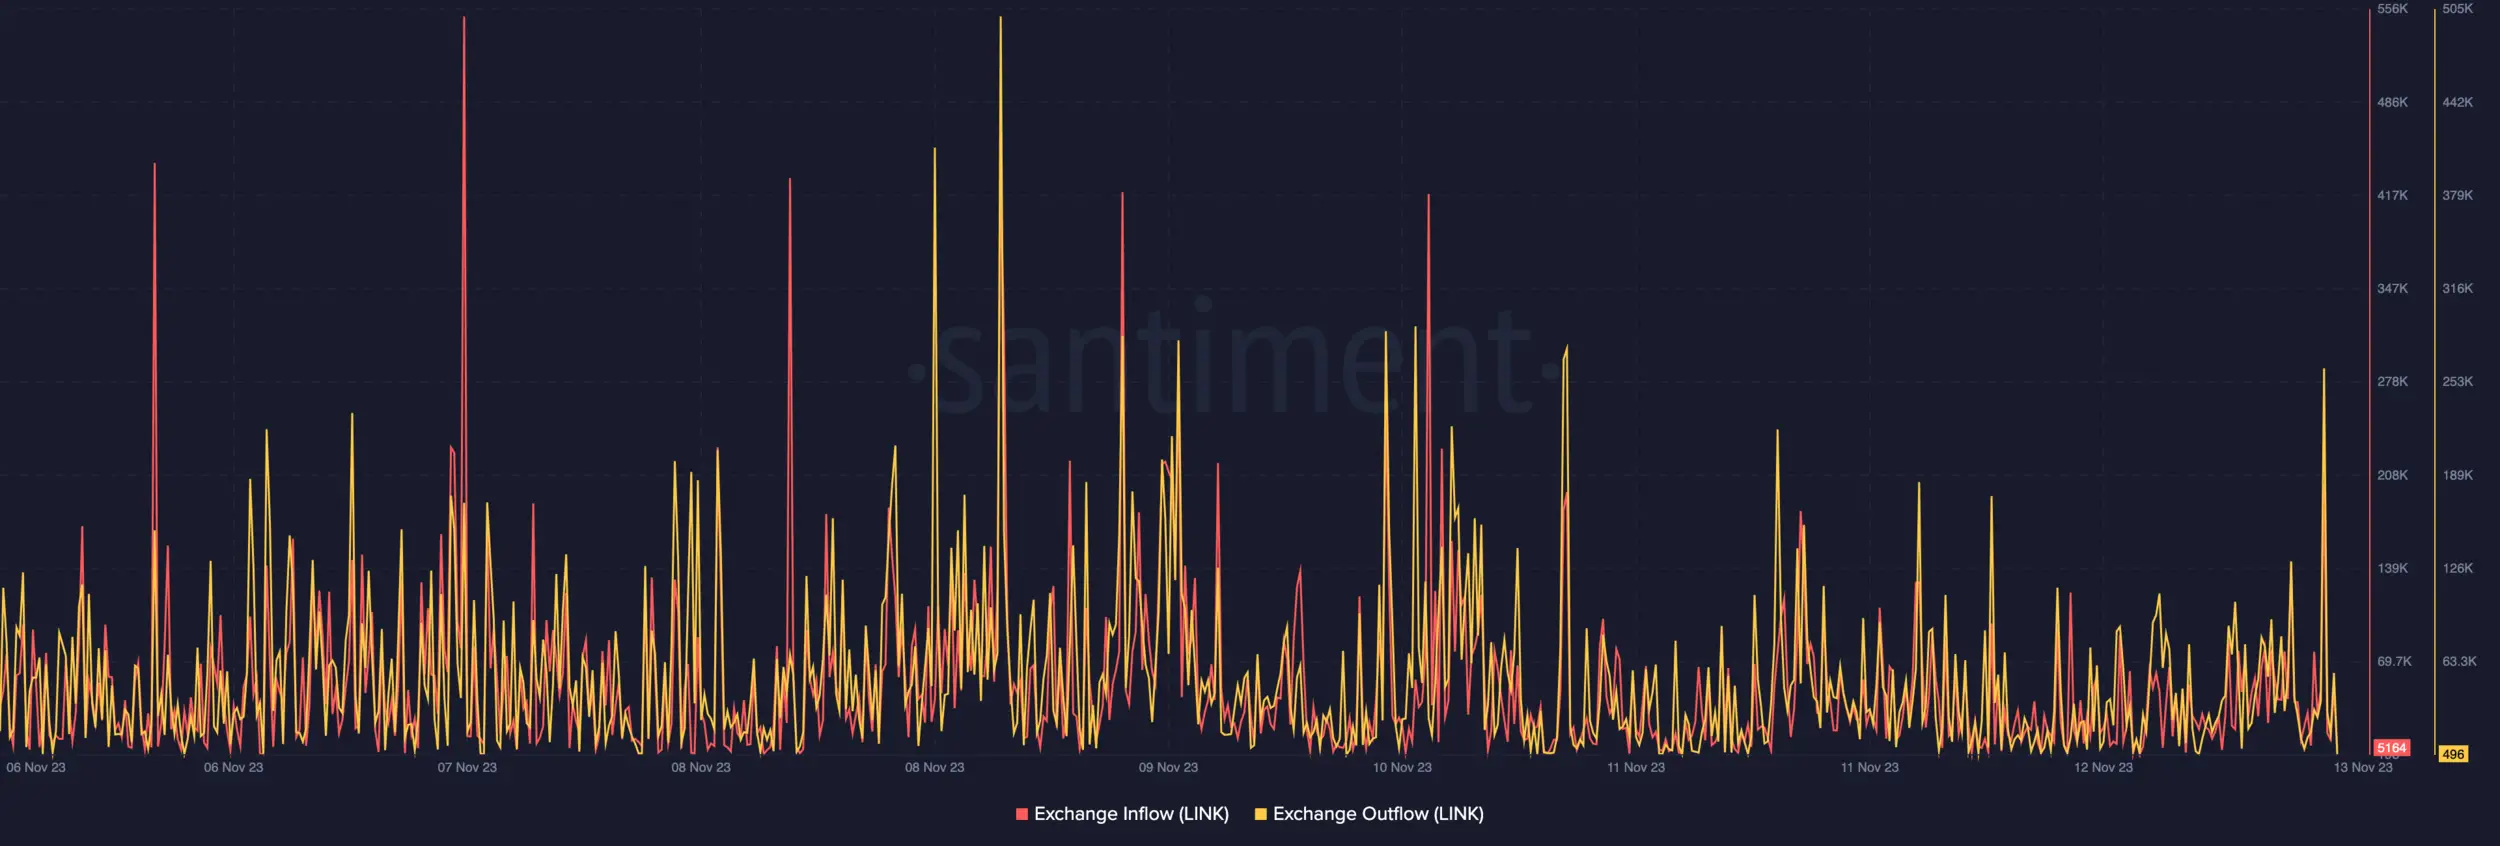
Source: Santiment
But in the last seven days, Chainlink’s inflow was 5164 while the outflow was 496. This large difference in the metric is confirmation that LINK sell-offs may be much in the coming days. So, holders may need to prepare to have their portfolio value affected.