Chainlink, IOTA, FTX Token Price Analysis: 28 October

Most digital assets recorded negative gains on their daily charts today, as the bears controlled the market. Chainlink and FTX Token remained just above their key support levels following a strong sell-off witnessed on the trading charts.
IOTA too remained bearish and was in for another possible downward price action over the upcoming trading sessions.
Chainlink [LINK]

Source: LINK/USD on TradingView
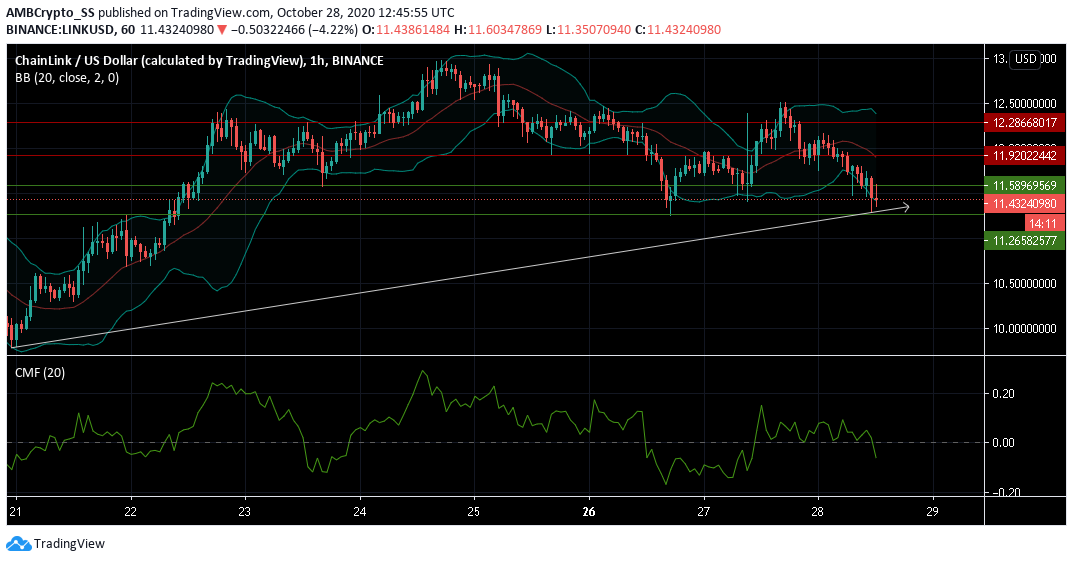
The 6th largest cryptocurrency recorded a market cap of nearly $4.5 billion and was down by 6% since yesterday. At press time it was trading at $11.432
The Chaikin Money Flow Indicator was well below the zero line, with capital outflows being greater than inflows.
This may put pressure on buy liquidities, and with a rise in volatility levels seen from the widening Bollinger Bands, another downward price action siding with the bears may just be around the corner.
The recent price correction witnessed on the digital asset’s trading charts had pushed down the prices, near the confluence of the trend line and the immediate support level at $11.265
IOTA

Source: IOTA/USD on TradingView
IOTA traded in the red today and was down by about 2% and dropped towards its immediate support levels. A bearish crossover, below the zero line was visible in the Awesome oscillator, indicative of strong selling pressure in the IOTA market.
The dotted lines of the Parabolic SAR above the price candles also supported a downward price action.
If IOTA bears manage to push prices towards the $0.264 support level, then chances of a short-term price recovery for the digital asset may seem unlikely over the next few days.
FTX Token [FTT]

Source: FTT/USD on TradingView
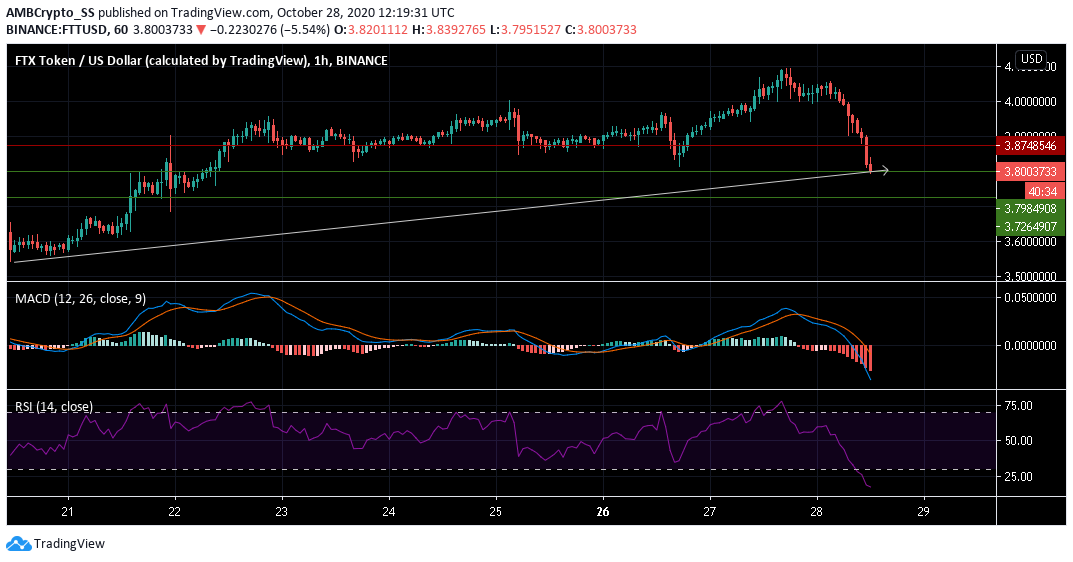
FTX Token was seen falling towards the $3.798 support level recording losses of almost 6% since yesterday. The bears seemed to have gathered good selling strength, and the same was visible from its technical indicators.
The MACD line was seen forming a bearish crossover below the signal line. Relative Strength Index also was well into the oversold territory. This indicated the presence of a strong selling sentiment in the FTT market.
Given, the recent sell-off, a continuation in the price correction remains an open possibility, as the overall selling sentiment is likely to result in a few more bearish trading sessions.


