
Crypto Fear and Greed Index stayed unchanged from the previous day at 71. The weekly and the monthly candle closed at $13,800 which is a high timeframe resistance level, and the last major level before ATH. Chainlink attempted a break to the upside but was strongly rejected. IOTA and DigiByte continued to trend lower in the face of selling pressure.
Chainlink [LINK]
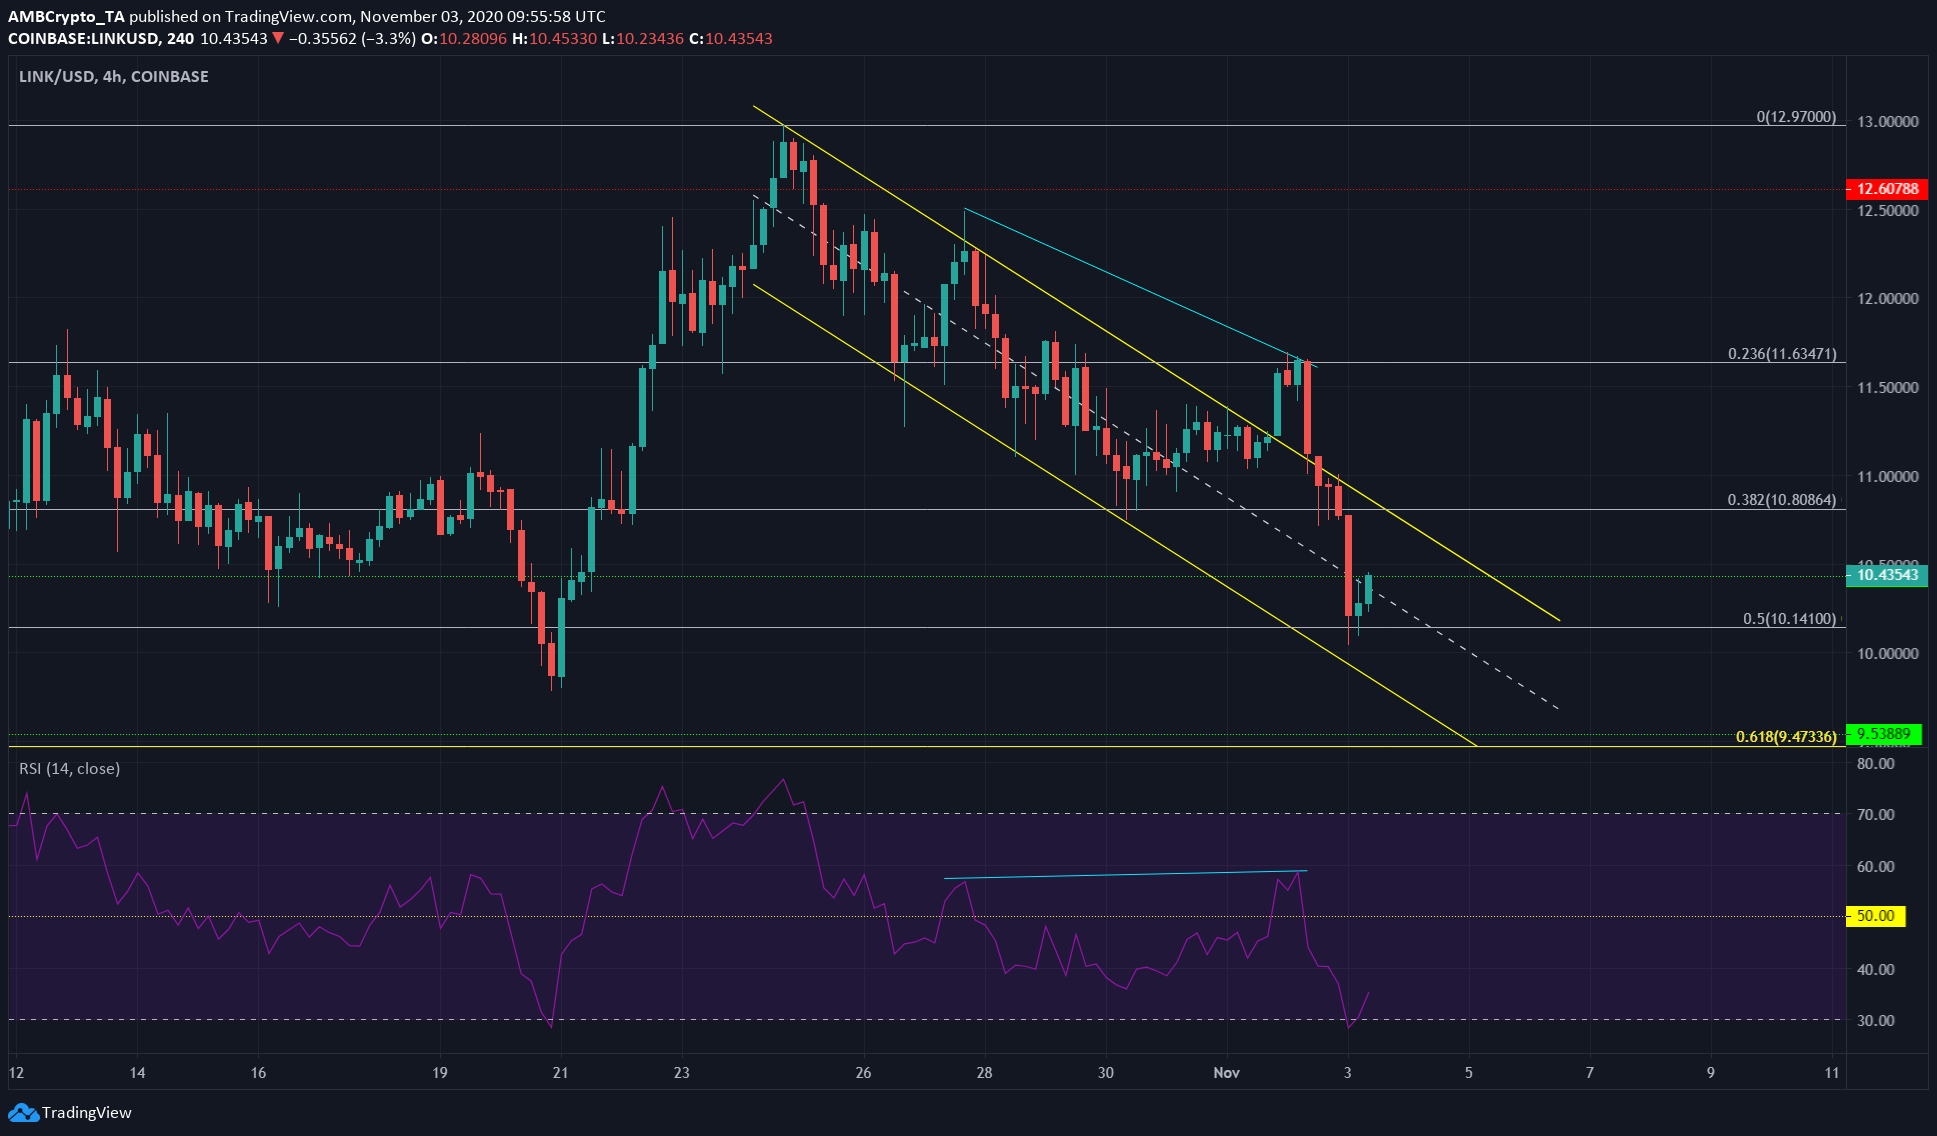
Source: LINK/USD on TradingView
The Fibonacci Retracement tool for the move from $7.3 to $12.97 last month was used to acquire some important levels to watch.
Chainlink was moving within a descending channel over the past few days. It broke out to the upside, with a target of $12.6, but the level at $11.6 was too strong to overcome. LINK also showed a bearish divergence (cyan) between price and momentum.
LINK was pushed back within the channel, and at the time of writing had bounced off support at $10.14 and retested $10.42 as resistance. The RSI was in oversold territory, so LINK could bounce a bit higher.
However, the momentum has clearly been bearish for LINK. A close below $10.14 could see it go to $9.47.
IOTA
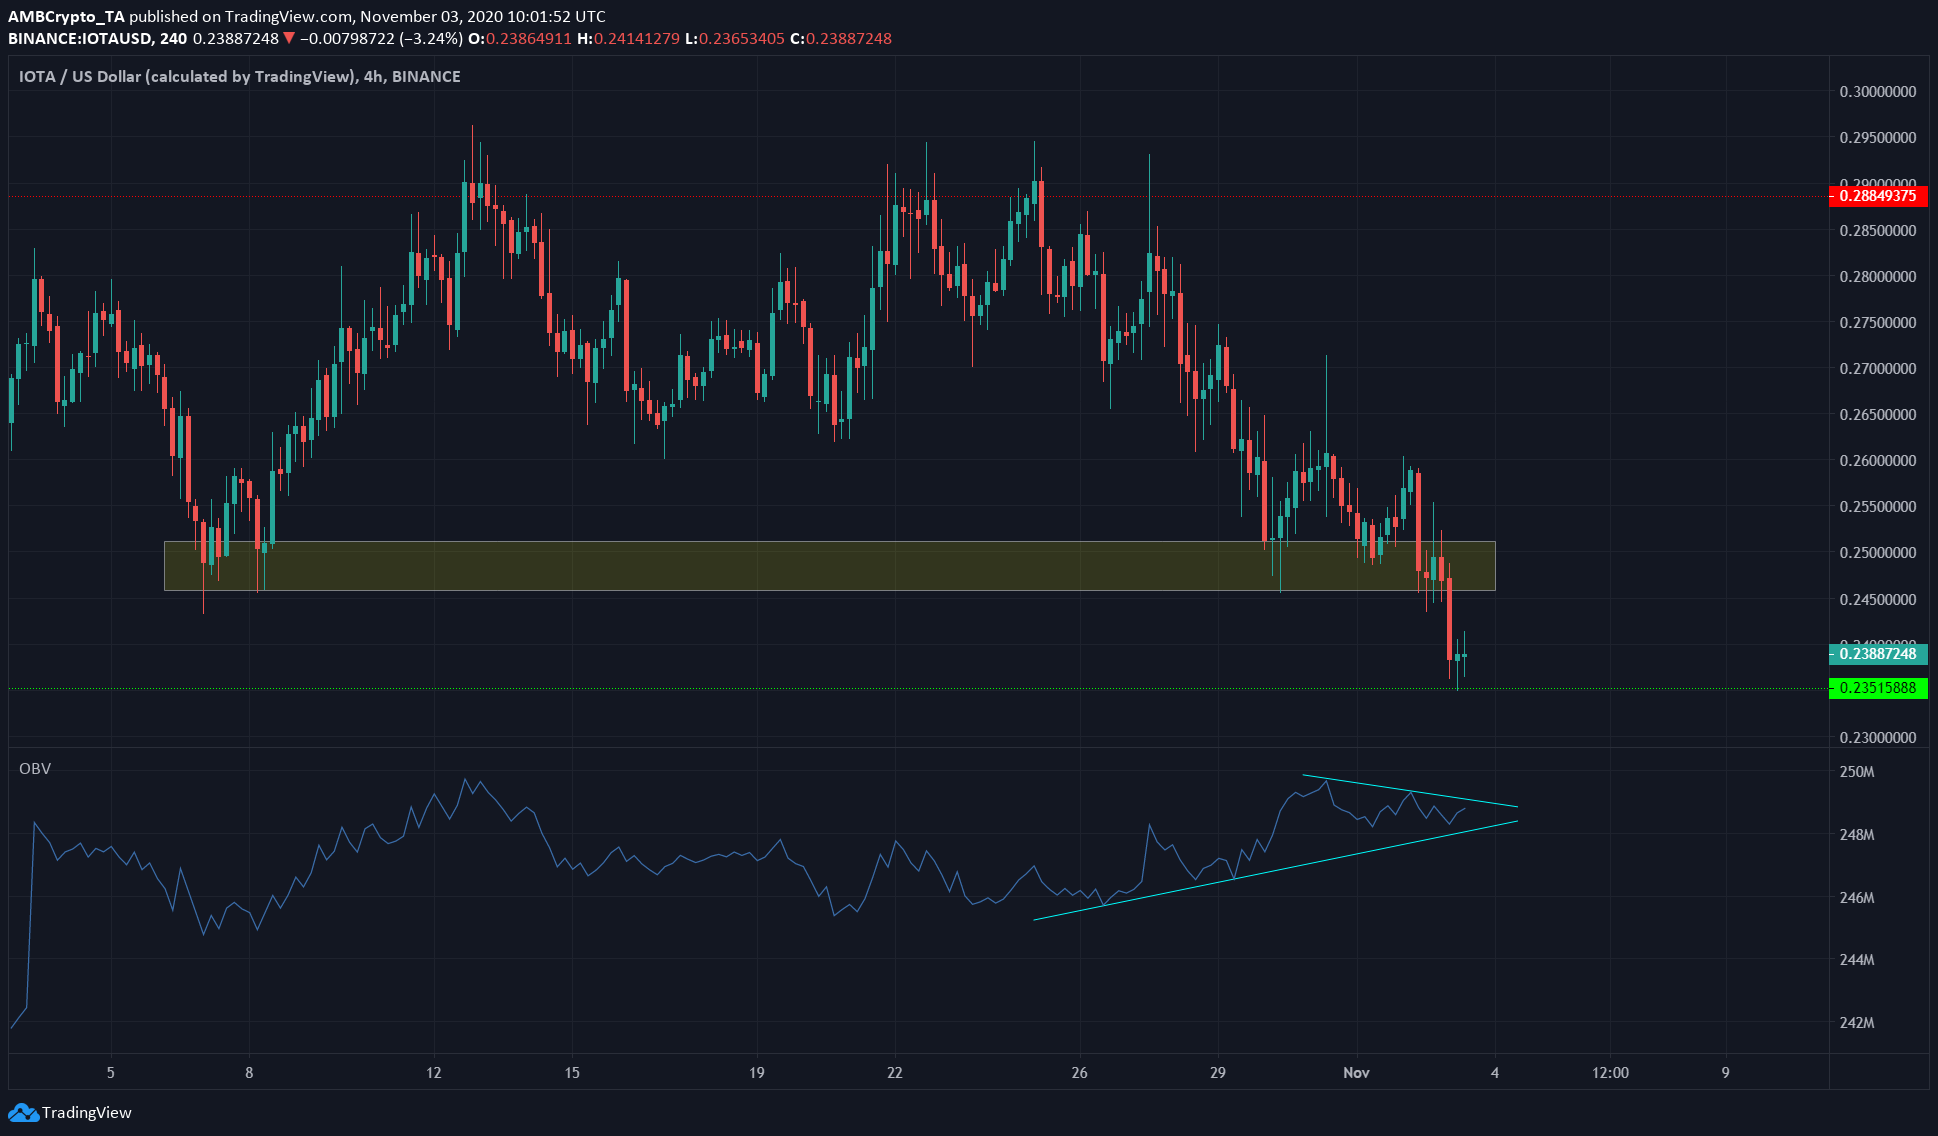
Source: IOTA/USD on TradingView
The shaded region represented a zone of demand for IOTA. However, recent bearish pressure pushed IOTA beneath the zone to find support at the $0.235 level.
The OBV has been trending lower in the past few days, as it formed a series of lower highs. Yet over the past week, it has also been forming a series of highs, forming a symmetrical triangle.
With IOTA trading just above support, it could break beneath the level if the OBV saw selling volume. A defense of the level of support could see IOTA climb back toward the $0.245 level, which would be made more likely if the OBV rose above the triangle formed.
DigiByte [DGB]
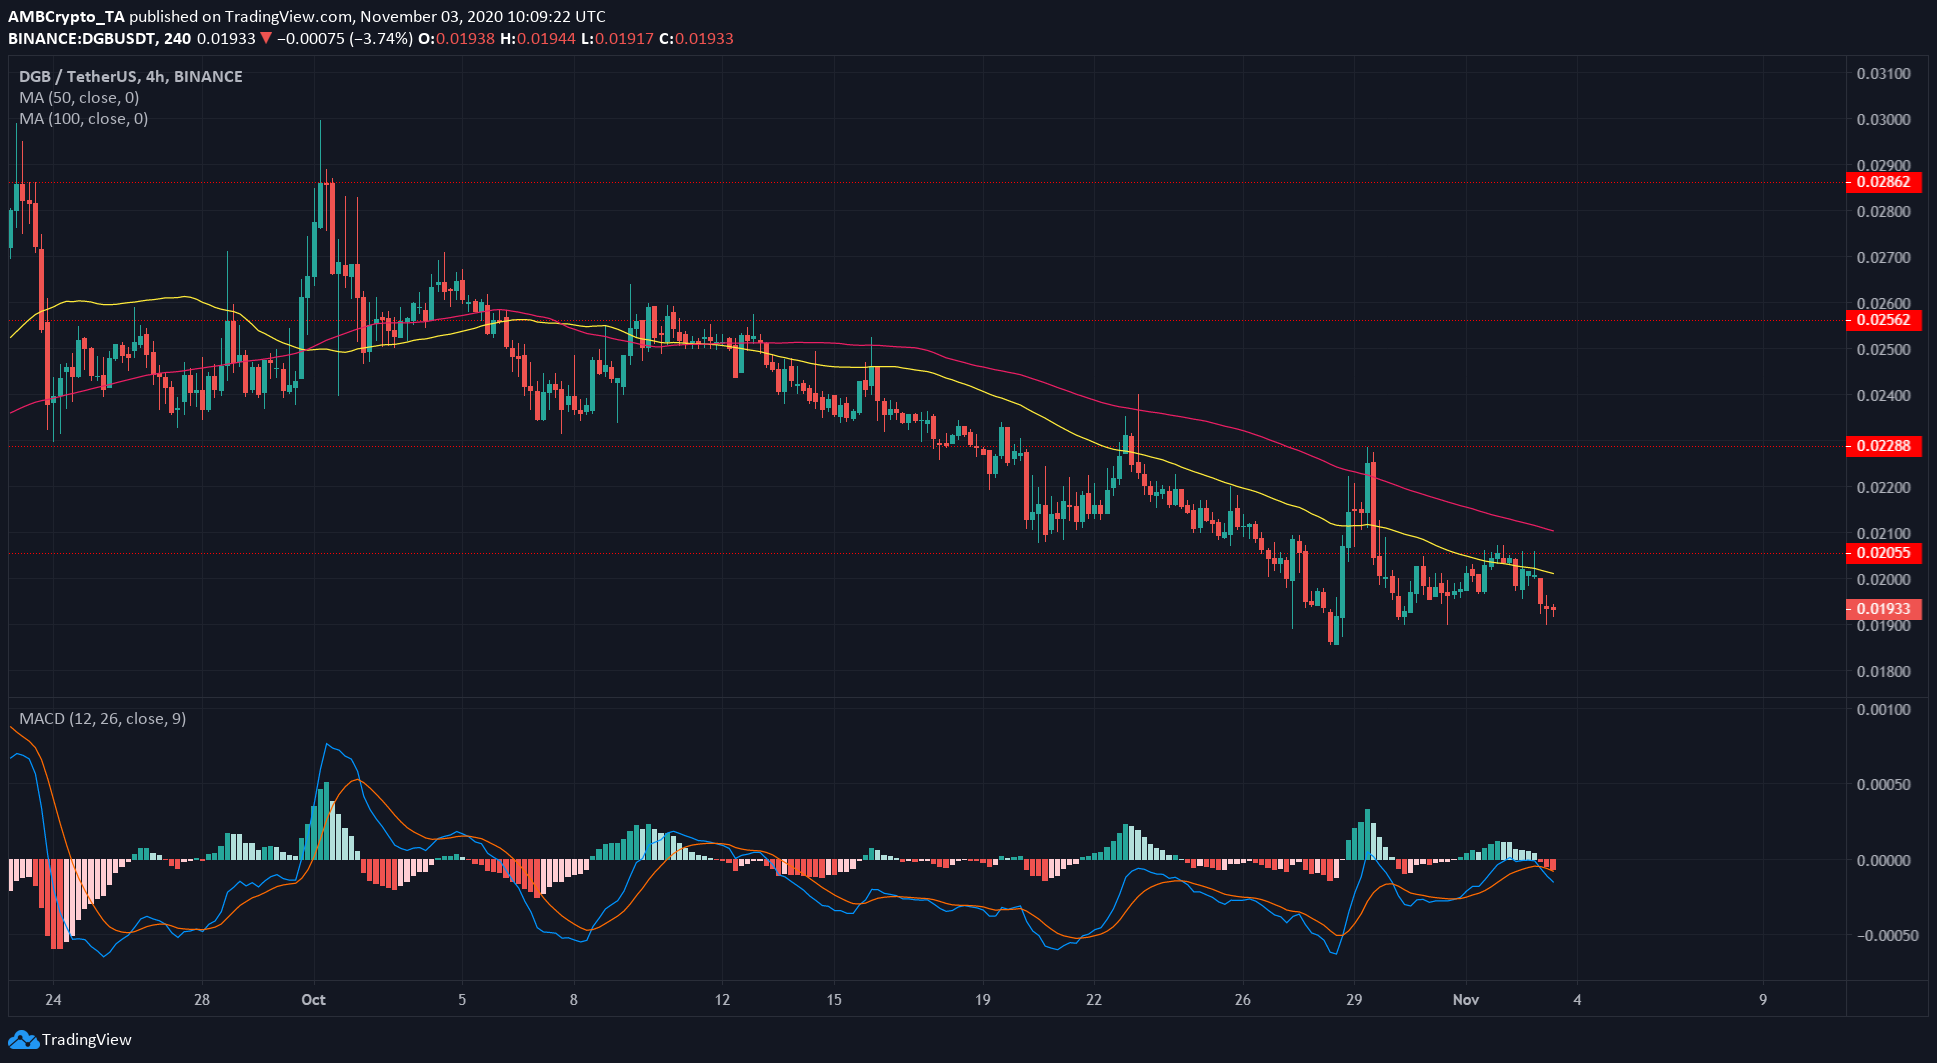
Source: DGB/UDST on TradingView
Not much changed for DGB. The bearish pressure was still evident, and it had failed to move above and flip a level of resistance to support.
The 50 SMA (yellow) was moving beneath the 100 SMA (pink), and the price was trading beneath these longer-term moving averages to denote strong bearishness.
The MACD was beneath the zero line and had formed a bearish crossover to generate a strong sell signal