Chainlink, EOS, VeChain Price Analysis: 16 October

During press time, the entire market seemed to be on a downward trajectory. The global crypto market cap followed the trail recording almost a percent in daily decline.
VeChain and EOS were poised for a southward price action towards their support levels, as mounting bearish pressure and low buying volumes existed for the two digital assets. Chainlink too well below its moving averages were seen heading towards the bears.
Chainlink [LINK]

Source: LINK/USD on TradingView
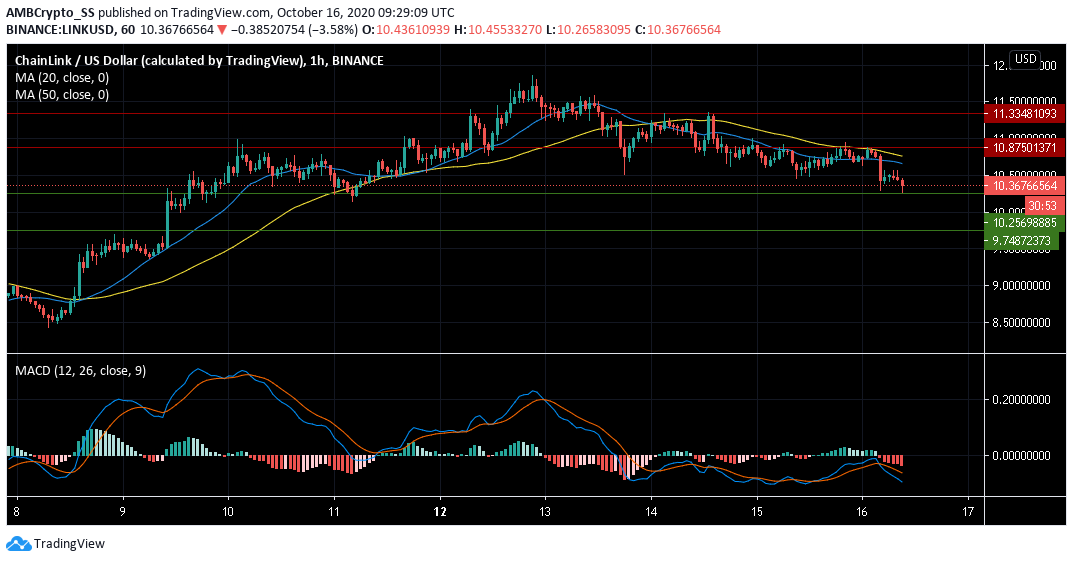
Since the last 24 hours, Chainlink was down by a percent, trading just above its immediate support at $ 10.256
LINK further failed to maintain its price above its 20 and 50-period Moving Averages, with the 20 SMA (blue) below the 50 SMA (yellow) -a clear sign of bearish momentum
Further indicating the strengthening of the bears, was signaled by the strong presence of selling momentum visible from the bearish crossover in MACD.
The downward price action indicated by MACD and the two SMA’s suggested a selling pressure could push down prices below the $ support level over the next few days.
EOS

Source: EOS/USD on TradingView
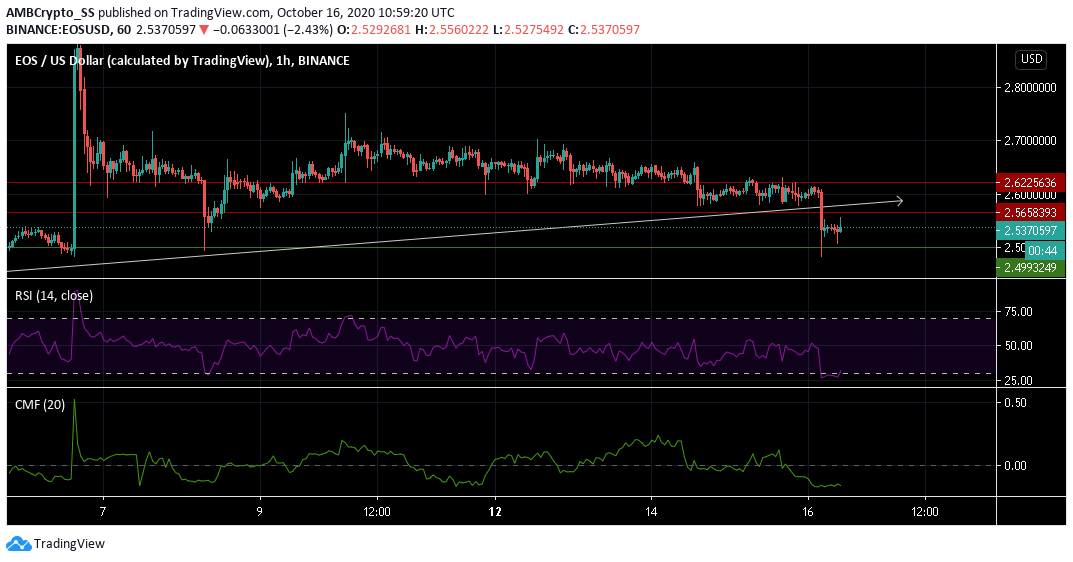
EOS at press time witnessed a bearish breakout below its trendline and recorded almost 9% in losses over the past one week.
Reposing below zero, the Chaikin Money Flow Indicator also revealed a bearish sentiment in the EOS market. Relative Strength Index followed suit as it dived towards the oversold territory.
If the bears continue to march on, EOS could witness a further drop towards the support level at $ 2.499
VeChain [VET]

Source: VET/USD on TradingView
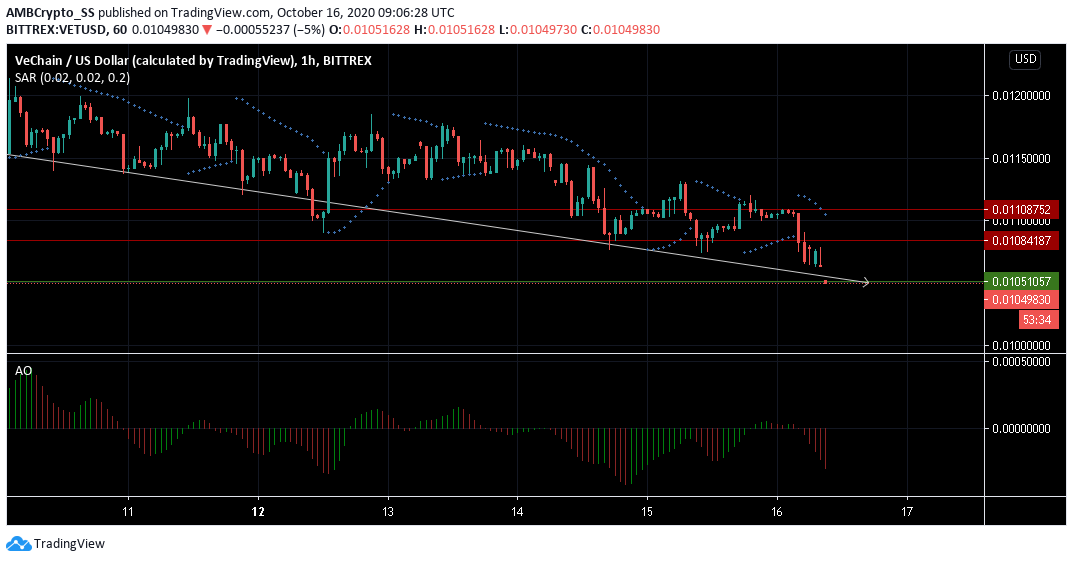
VeChain over the past one week has been consistently making lower lows, noting a downward price trend. At the time of writing it was hovering just above the $ 0.0105 support level.
In fact, the Awesome oscillator remained negative for the short term, as it made a bearish crossover below the zero line.
The dotted lines of the Parabolic SAR above the candles hinted towards a downward price trend for the upcoming trading sessions. However, a reversal was also unlikely given the bearishness observed in the short-term trend noted by the AO.
There was a high chance, prices would not accumulate around the $ 0.0105 support level, and could be seen moving downwards, maintaining a bearish drag.


