Cardano witnesses a respite from bears, forming bullish pattern with ~10% rise in the near future

Cardano hit an 8-month low last month after Bitcoin’s sudden fall in value on the 24th. As its value struggled to push back to earlier levels, it has currently been consolidating around the $0.038 to $0.039 mark. However, charts indicated a possible breakout into a bullish pattern.
Cardano 4-Hour Chart

Source: TradingView ADA/USD
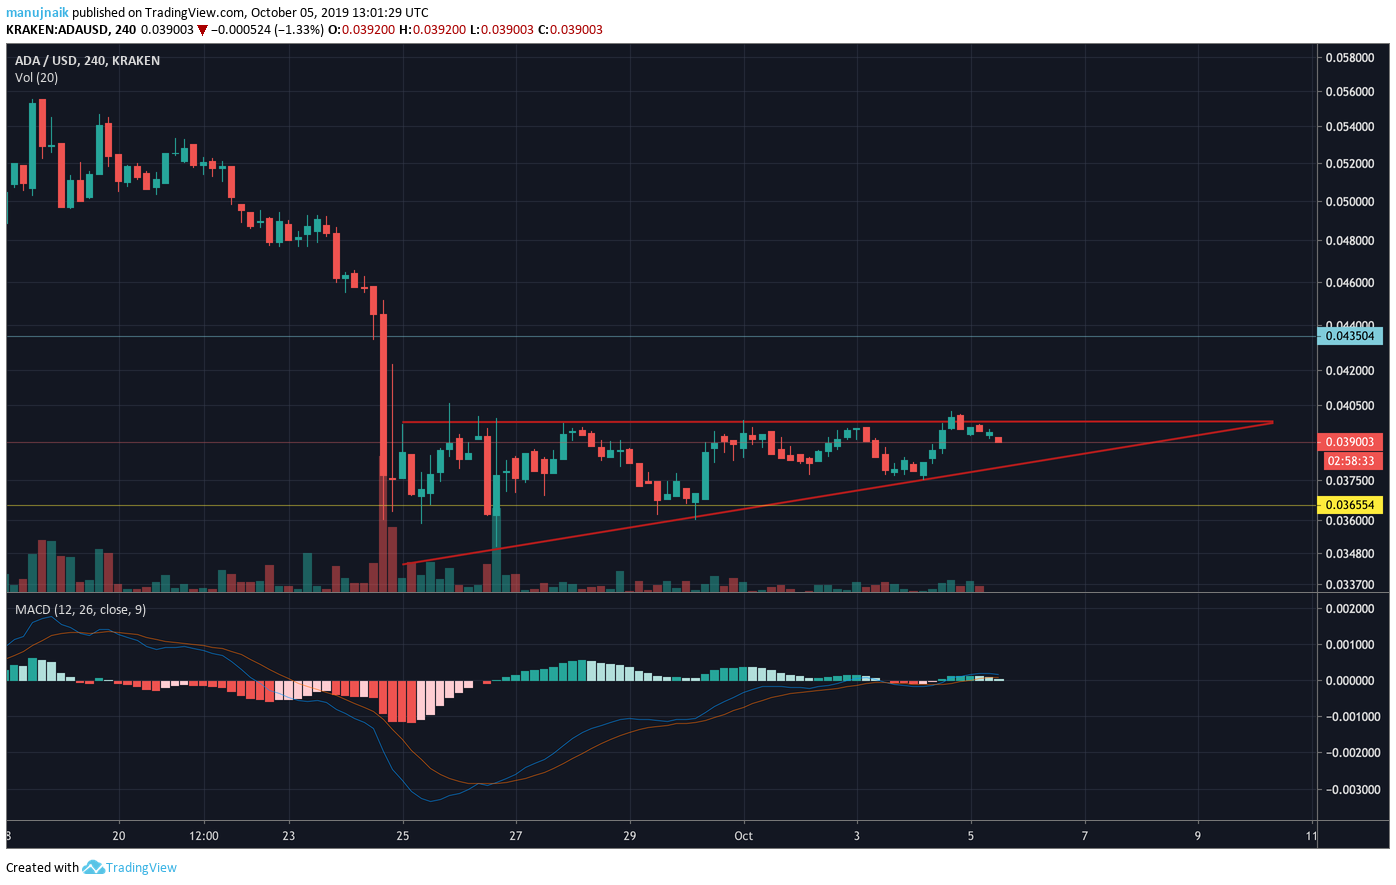
4-hour ADA/USD chart showed that the price entered an ascending triangle pattern after the price drop on the 24th, confirmed by the lowering volumes since then.
An ascending triangle pattern was seen when the price moved between two converging trendlines, with the top trend line horizontal and the bottom trend line sloping upward. For this kind of pattern, there is a 63% chance of upwards breakout, and MACD indicator supported this case as the signal line looked to be about to make a bullish crossover.
While the price did test the $0.0399 resistance today, it failed to breach the ascending triangle, meaning the breakout may only happen in the days to come.
Once the ascending triangle is breached, however, the price will have to test the $0.0435 mark, after which it could rise as high as $0.054, forming an inverted Bart pattern, though historical data suggests the price may only rise as high as $0.045.


