Bitcoin’s latest pump towards $11,500 changed the outlook of many altcoins from bearish to neutral or bullish. While Cardano bounced strongly off a level of support and formed a continuation pattern on the charts, Compound moved above its long-term descending trendline, although a rise in price was yet to take place with momentum. Waves, on the contrary, showed a lack of movement.
Cardano [ADA]

Source: ADA/USD on TradingView
On the Awesome Oscillator, highlighted in cyan was a bullish twin peak setup, with ADA bouncing off the $0.09-support to reach a local high of $0.11.
In fact, the cryptocurrency’s price also broke out of a month-long descending channel, shown in white. This breakout occurred on the back of good trading volume also.
At press time, a bull pennant was observed to form on the charts. This pattern usually points to a continuation in the uptrend, although a close above either trendline was required. A close under the same could see the price go to $0.1036, before another wave upward.
Compound [COMP]

Source: COMP/USDT on TradingView
Compound hit new lows recently near $100, although it bounced back a little soon after. Whether this was a dead cat bounce or the beginning of recovery wasn’t clear, at press time.
The cryptocurrency’s price formed a rectangle top, shown in white. This is a pattern that generally sees the price break to the upside, although a descent was also possible. A close above either boundary can be considered to be the next heading for the crypto-asset.
Further, a close above could see COMP test the resistance at $125, while a close below could take COMP beneath the descending trendline.
Finally, the CMF presented an equilibrium between buyers and sellers, at the time of writing. The trading volume within the pattern was also slightly lower than it recently was.
Waves [WAVES]
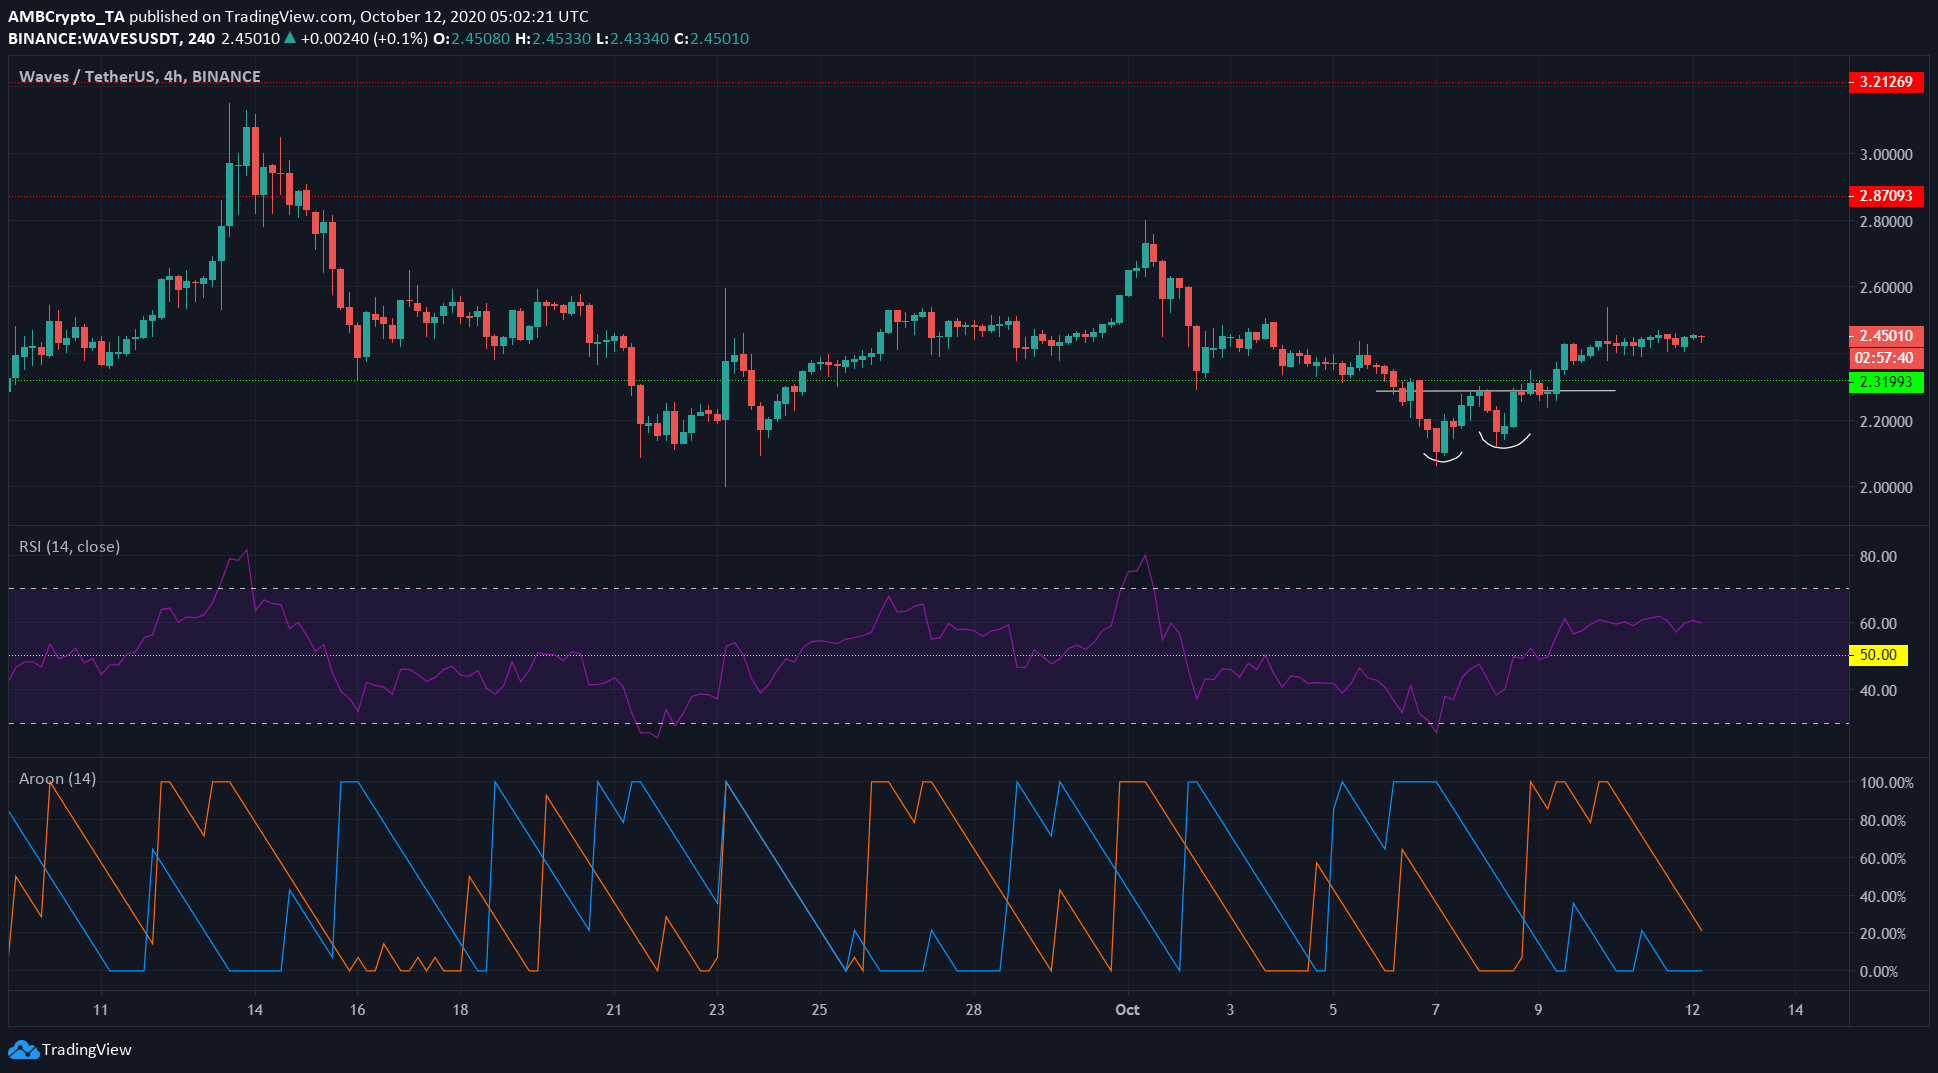
Source: WAVES/USDT on TradingView
Waves formed a double bottom pattern and bounced, but in recent days, the crypto-asset has shown no real direction. The Aroon Indicator highlighted this, with the Aroon Down making the bottom while Aroon Up moved south, indicating that no new high was made over the past 14 periods.
The RSI was in bullish territory with a reading of 59, but WAVES might be pushed down due to the previous downtrend’s pressure.