Cardano short-term Price Analysis: 28 June

At the time of writing, Cardano recorded YTD gains of 134.84%. While many smart-contract coins have witnessed notable upticks, it was ADA that posted an impressive rally, outperforming its contemporaries over the past couple of weeks. As the release of Cardano Shelley code on 30th of June remains on schedule, the price of the native crypto has been reacting well to the news.
Cardano [ADA] Daily Chart:

Source: ADA/USD on TradingView
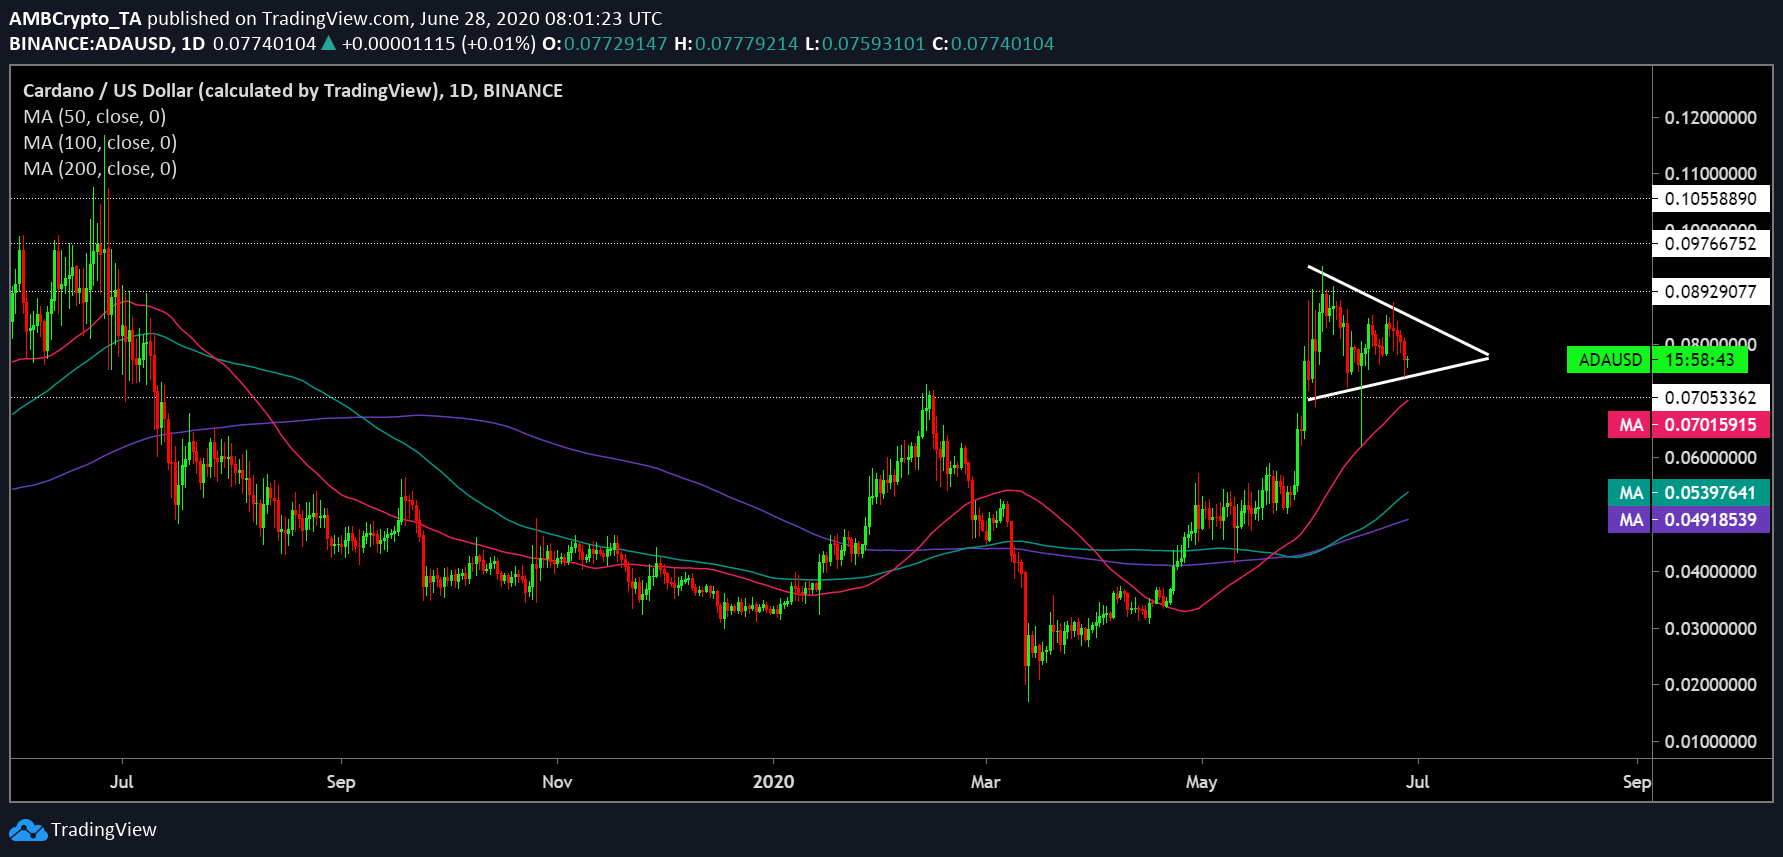
As demonstrated by the above chart, Cardano’s price candles appeared to be oscillating between the trendlines of a symmetrical triangle pattern, the completion of which was predicted to take place in the fourth week of July. A breakout could be on either side.
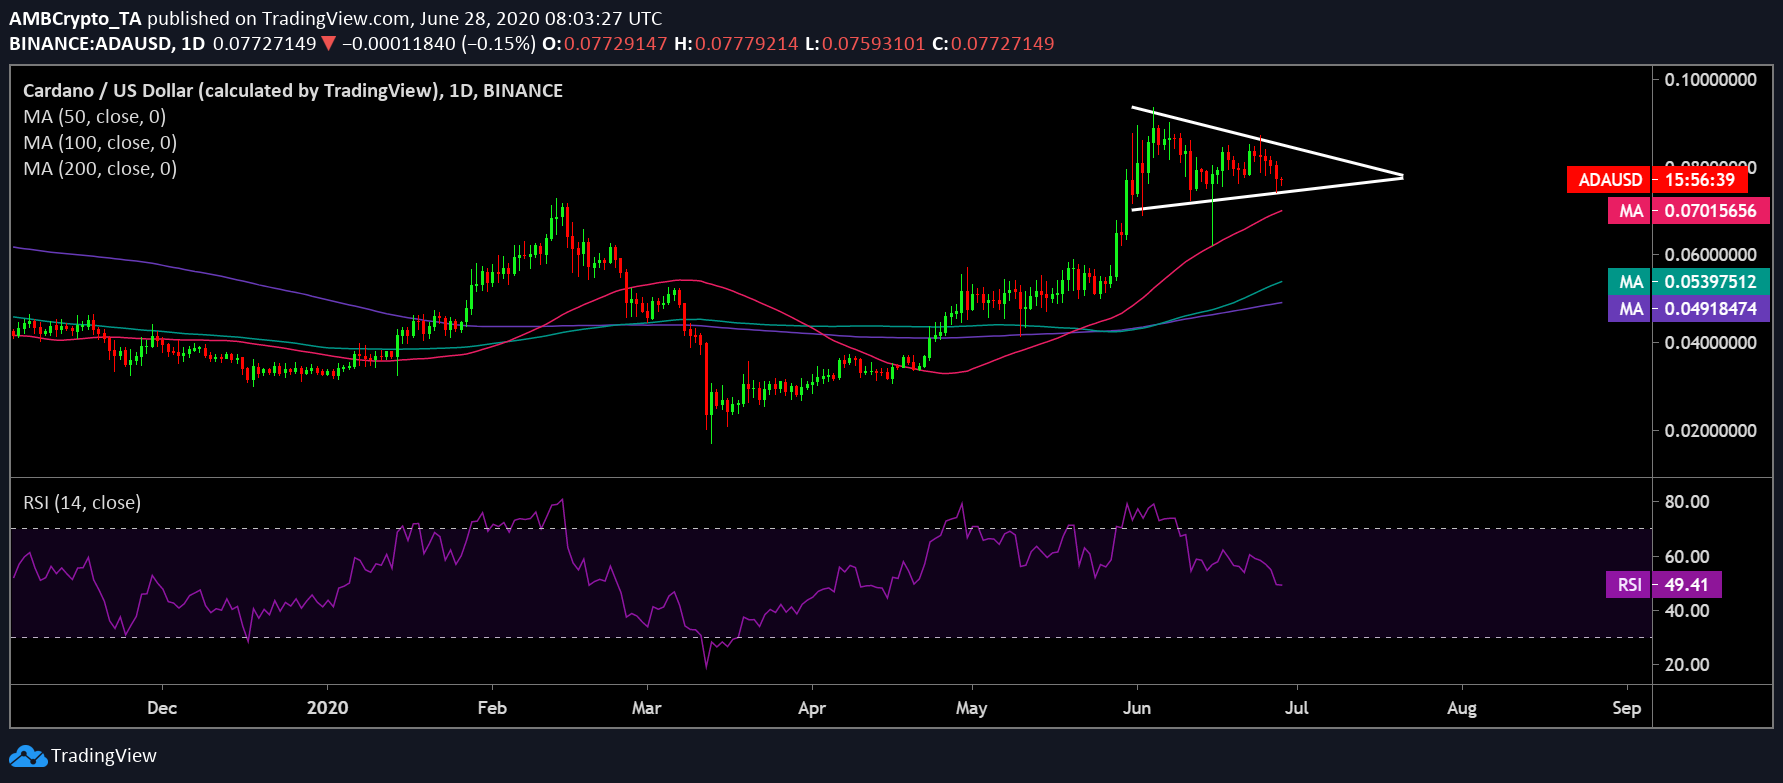
Daily moving averages continued to exhibit the presence of bullishness in ADA’s fate. 50 DMA [Pink] continued to remain above 100 DMA [Blue] as well as 200 DMA [Purple]. While 100 DMA underwent a bullish crossover with 200 DMA recently, this trend continued at press time. In addition, all DMAs formed crucial points of support for ADA price candles, resisting any downward price action.

Source: ADA/USD on TradingView
Following the latest dip in the market, ADA underwent a pullback which prompted RSI to fall slightly below 50-median line. However, RSI has noted significant support at this level and a further downtrend to the sell-off territory could potentially be averted.
As depicted by the above long-term charts, ADA appeared to be primed for gains as the community anticipates the high-profile Shelley release. A potential bullish breakout in the last week of July could propel the coin to climb all the way to $0.0892. If the coin gains necessary momentum, it could further target $0.0976, a level unseen since June 2019.


