
Disclaimer: The findings of the following article are the sole opinion of the writer and should not be taken as investment advice
Bitcoin’s latest failed attempt at a sustained breach of $16,000 has given the market’s altcoins the chance to do more, by surging higher or by stopping its slide down the charts. With Cardano, that wasn’t the case at press time, and ADA’s outlook projected a bearish downfall soon.
Brief moments between Bitcoin’s surge and pullbacks are when altcoins thrive, especially in a pre-bull run phase that Bitcoin is in. Alt seasons have a similar trend. The following article focuses on ADA and analyses its price trend for the medium-to-long-term.
Cardano 1-hour chart
Source: ADAUSD on TradingView
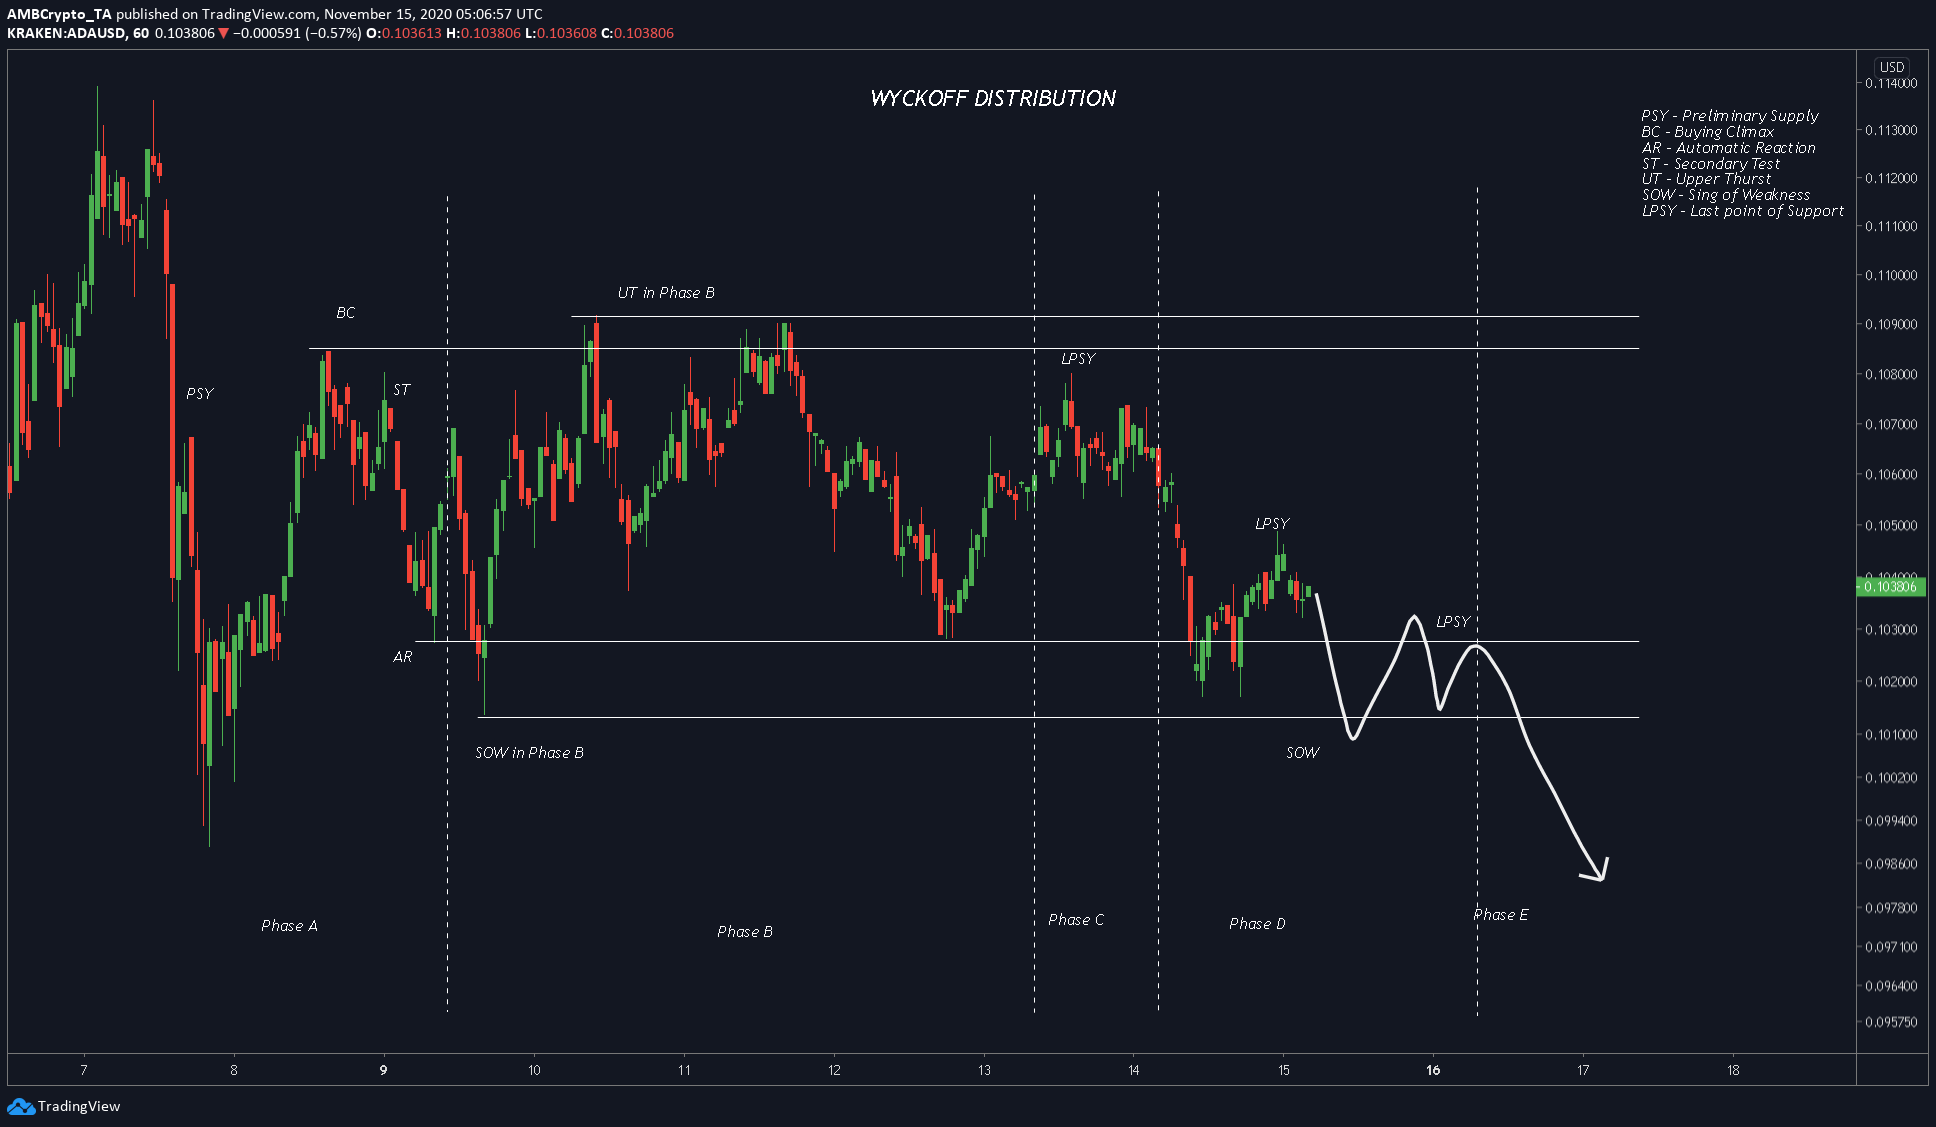
The attached chart highlighted ADA’s price movements beginning from the second week of November. As can be observed, ADA did note a huge drop transitioning from the 1st week to the 2nd week. Since then, the price has been in a consolidation phase on the charts. As seen above, the consolidation looked like a typical Wyckoff distribution, hence, we can expect ADA to drop soon.
We can see ADA at the SOW [Sign of Weakness] level at $0.10129. After this level, we can expect ADA to move sideways trying to find a strong foothold on the charts, failing which, we can see it drop down to the target levels mentioned below.
Rationale
Source: ADAUSD on TradingView
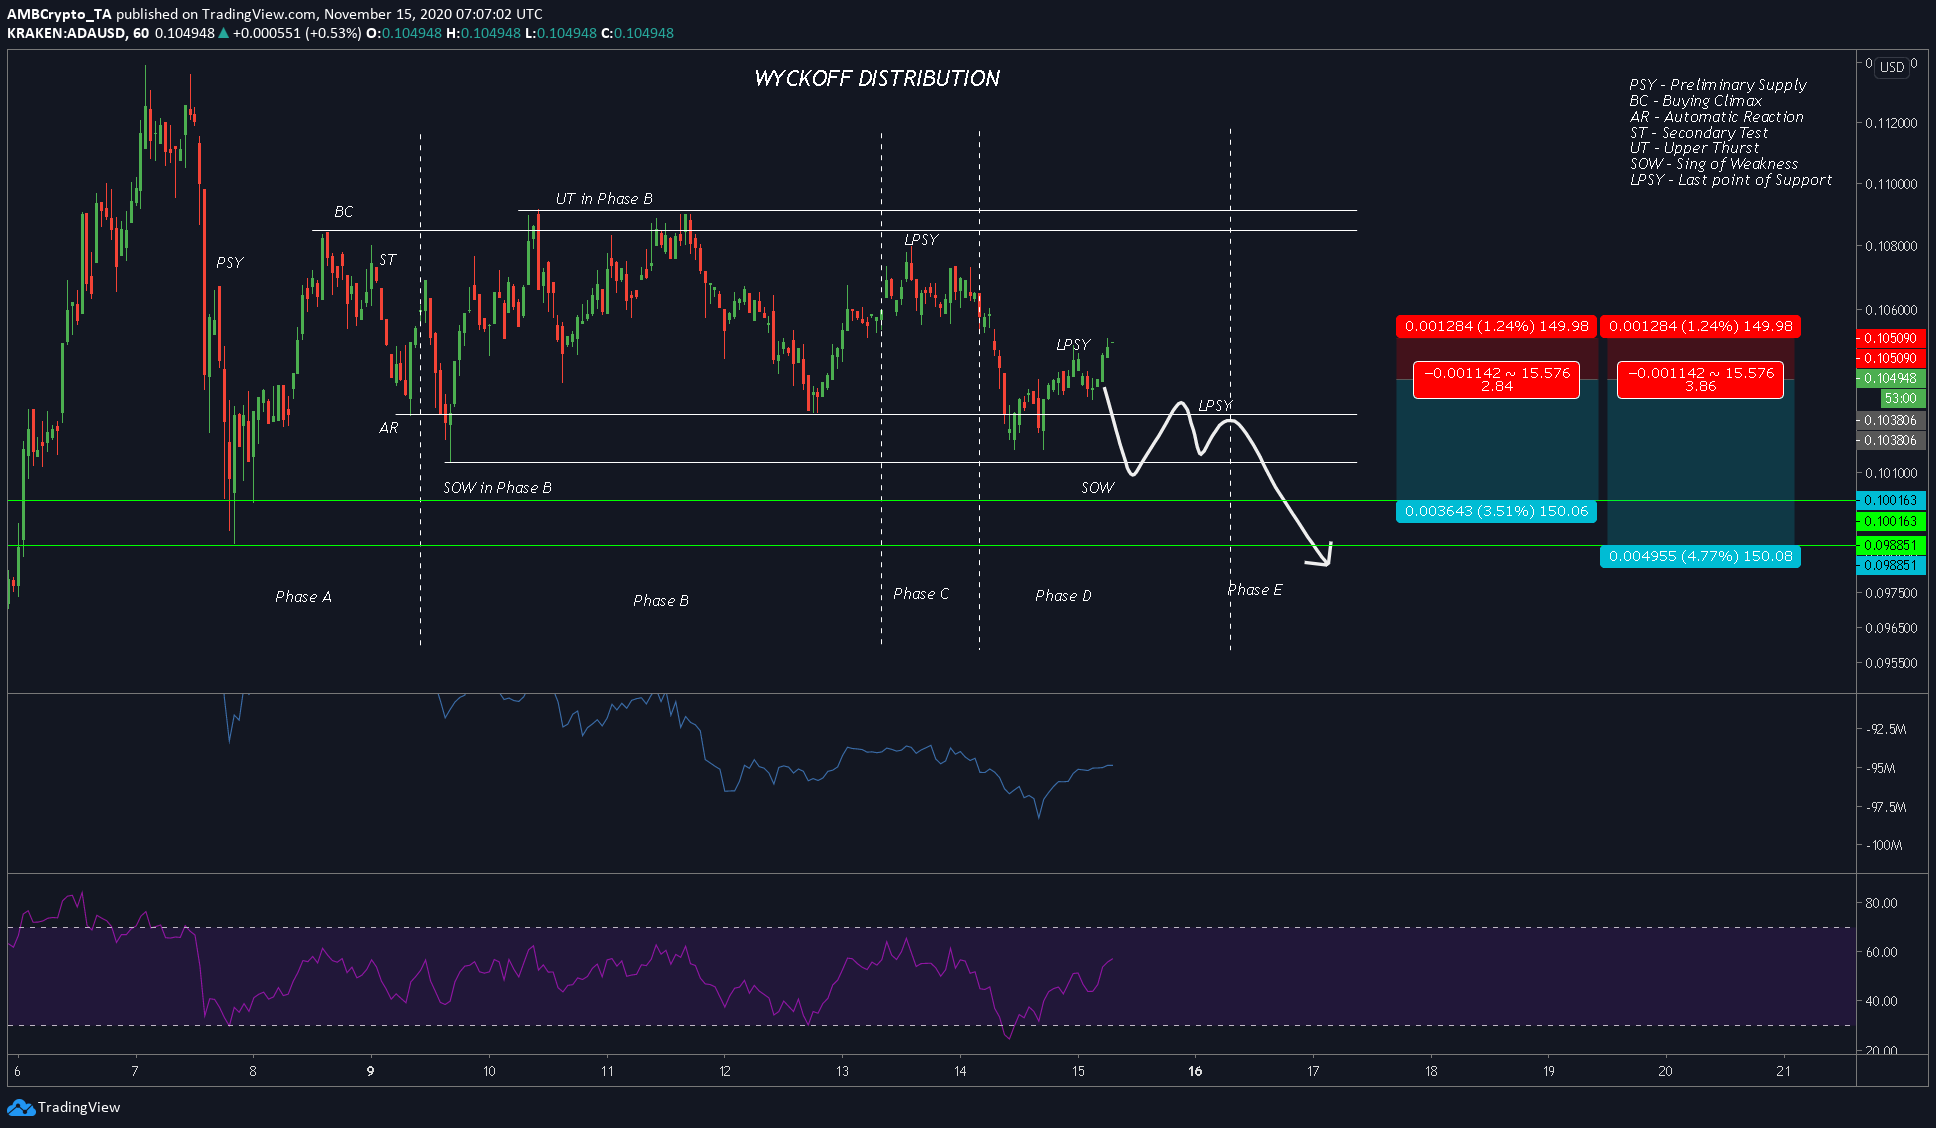
The main rationale is the Wyckoff distribution, as explained above. Typically, a distribution is a sign of losing/weakening bulls and hence, the final drop. With ADA, however, the drop will not be too much.
The RSI indicator was well above the neutral zone, at press time, and indicated that the price might head higher. However, 58.21 will be a resistance that might trigger a reversal. Further, the OBV indicator showed a slow surge in volume, as opposed to a drastic surge in price.
The price was also forming a smaller bearish flag, which pointed to an incoming drop.
Levels to look out for
The setup seemed solid, however, there was a chance that the price could surge higher, in light of the fact that the RSI was still above the neutral zone. The “leftover” bulls could come back to squeeze the short-sellers in the market.
Entry: $0.103806
Stop-loss: $0.105090
Take-profit: $0.100163, $0.098851
Risk-to-reward: 2.84, 3.86