
After touching a 2-month low on 24 September, Cardano underwent a reversal and the price flipped significantly on the charts. After breaching its key resistance level on the daily timeframe, the crypto-asset was valued at over $0.10, at press time. However, the rally might have been a little too abrupt, which may be why another steep correction was soon noted on the charts. Interestingly, the immediate support at $0.09 might attain a stronger base than expected.
Cardano 12-hour chart
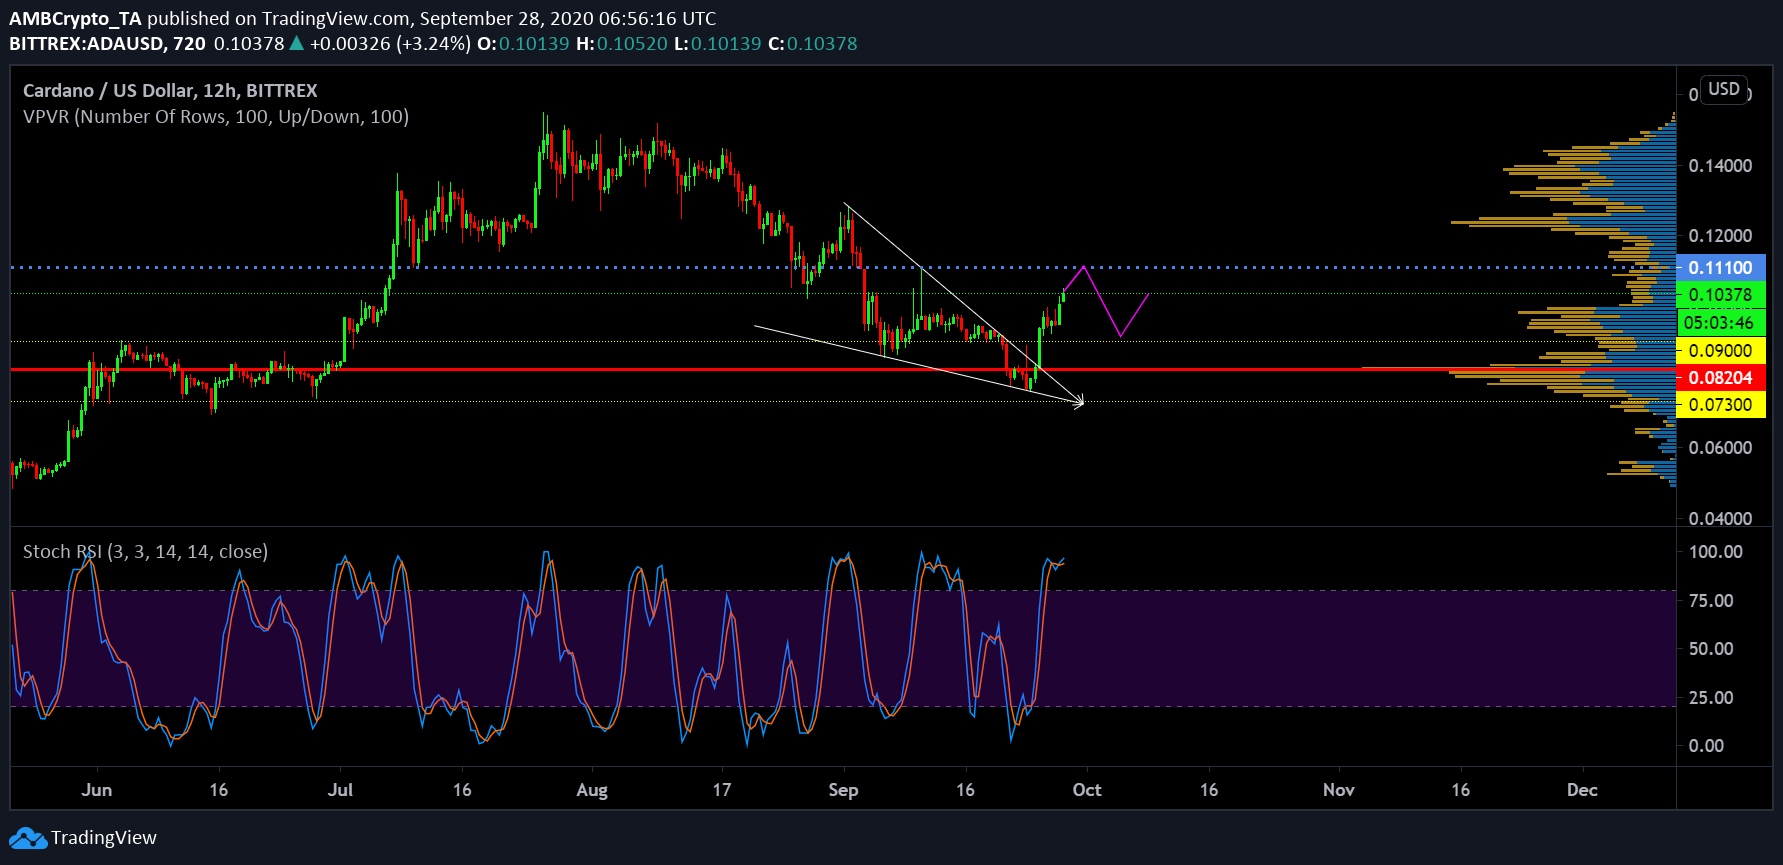
Source: ADA/USD on TradingView
Unlike most major altcoins that peaked during the middle of August, for Cardano, the decline has been evident since the 26th of July. Cardano’s independent rally in May-June was extremely dominant, taking the valuation above $0.14. However, over the past two months, corrections have ensured a cool-off period.
The recent breakout north manifested on the back of a falling wedge after ADA came extremely close to its support at $0.07300. The last time the crypto-asset was below this price point can be dated back to 24 July.
With the price taken all the way down to the oversold region, the value sprung back up, and within 3 days, the buying pressure had fueled a little bit of dominance. ADA might, ergo, rally over the next 24-hours to re-test the resistance at $0.1100. Alas, it will be a temporary affair.
With the Stochastic RSI indicative of a bearish reversal any moment, over the next week, a period of correction might ensure a drop down to $0.0900. Further, the VPVR indicator pointed to high trade volume at $0.0900, so a breach below this range can be possibly avoided.
Cardano Weekly Chart
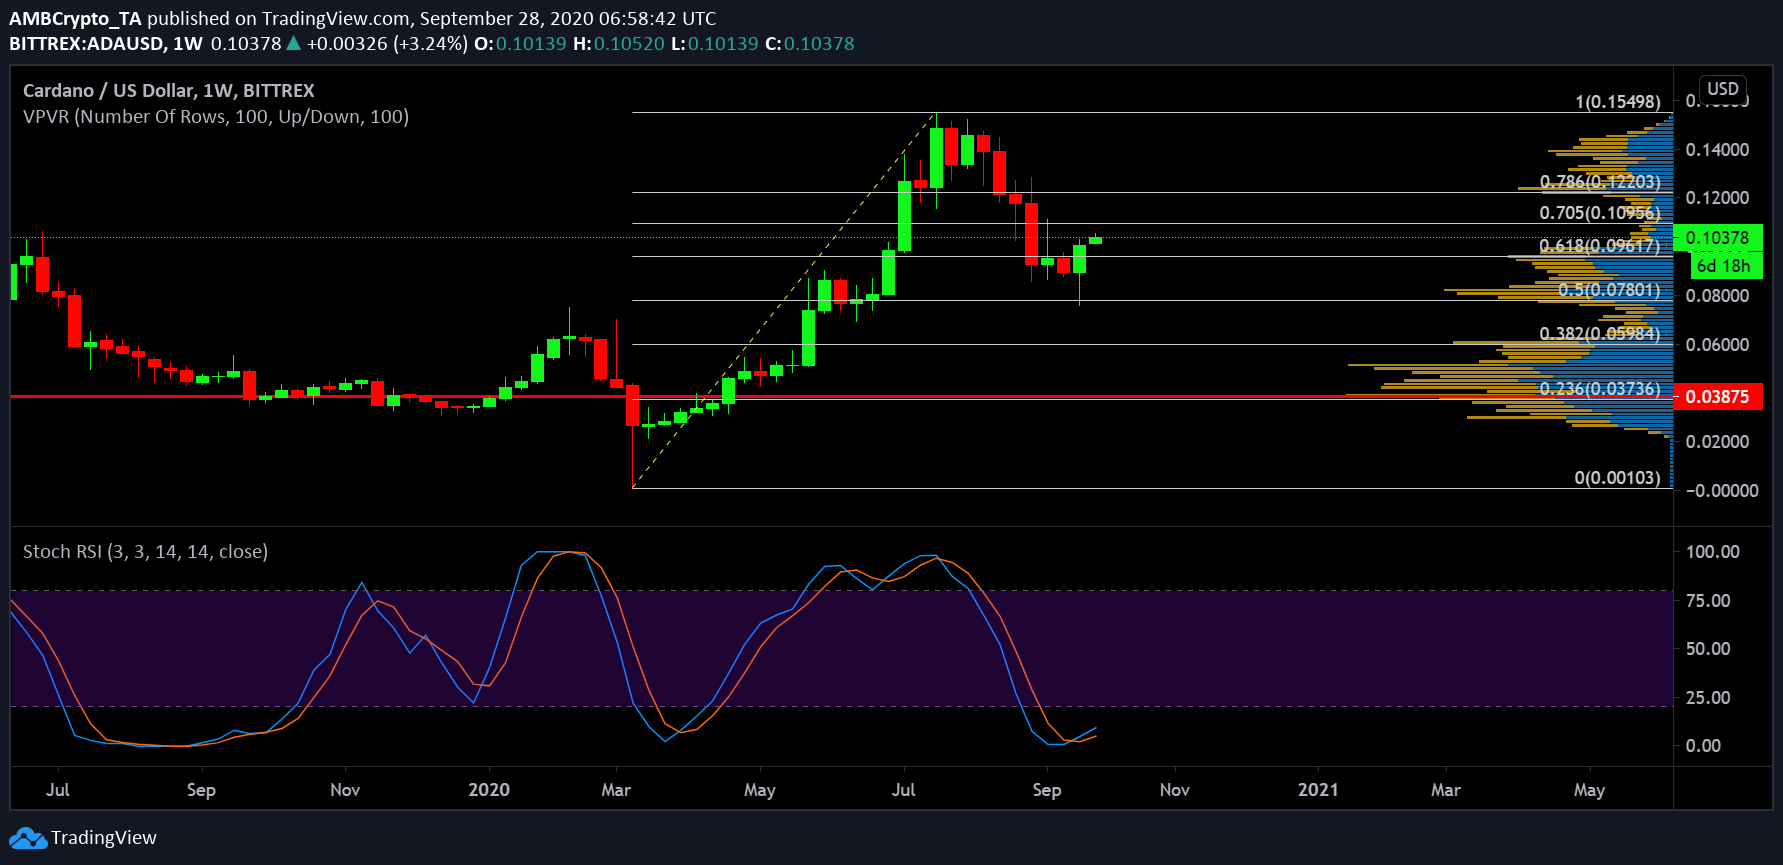
Source: ADA/USD on Trading View
Now, although the previous chart for Cardano seemed momentarily bearish, the 1-week chart appeared poised for a strong bullish rally. As can be observed from the charts, Cardano tested the weekly support at the 0.5 Fibonacci Retracement the previous week, and right now, a radical shift is seemingly taking place.
The Stochastic RSI also completed its bullish crossover so, over the next couple of weeks, ADA may as well take a position above $0.1100, sustaining a level right under $0.12200.