Cardano, IOTA, Algorand Price Analysis: 15 September

Bitcoin continued to surge and was trading at $10,825 at the time of writing. The sentiment around cryptocurrencies shifted from fear to neutral, as the Fear and Greed Index showed a reading of 47. A strong Bitcoin did not alter the fate of Cardano and IOTA which showed a lack of momentum in the markets. Algorand remained bearish but also displayed a lack of volatility in recent trading sessions.
Cardano [ADA]

Source: ADA/USD on TradingView
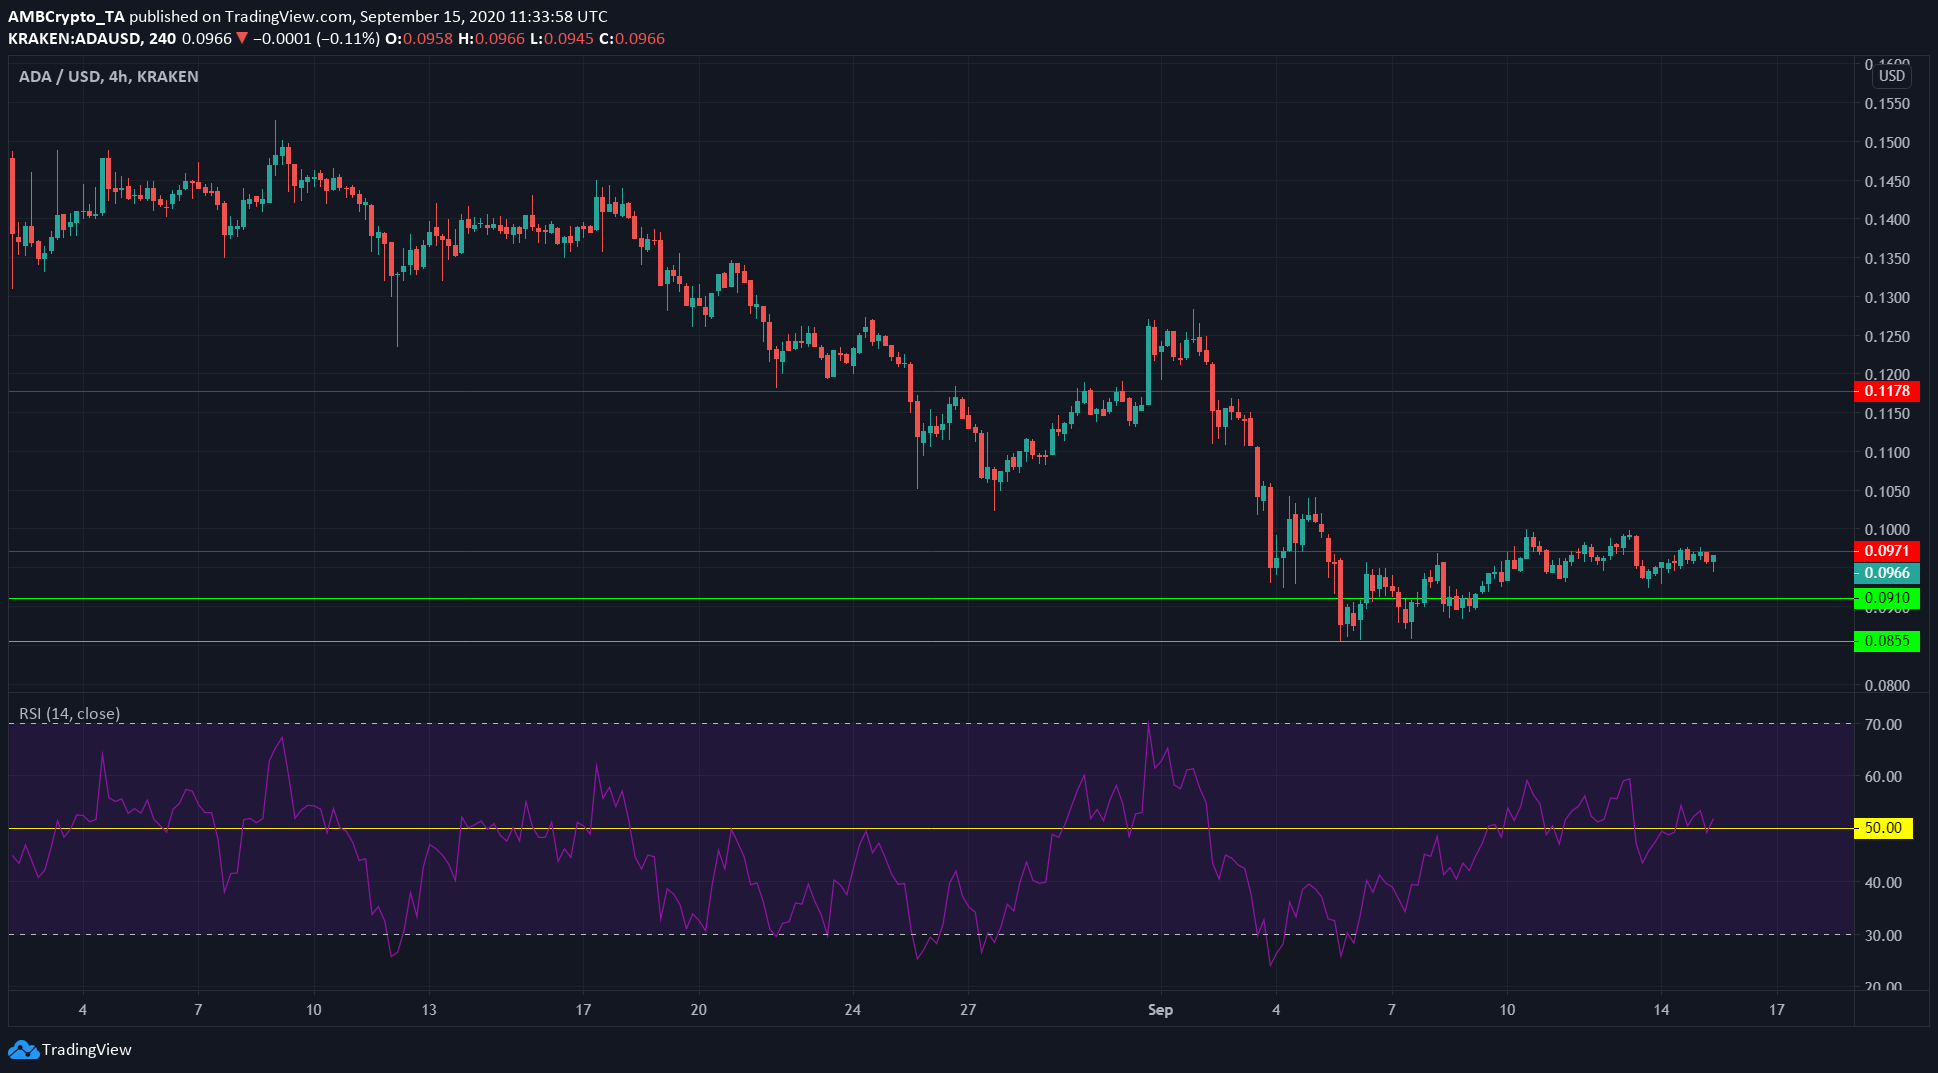
ADA showed a lack of momentum in the markets as it traded beneath resistance at $0.097.
RSI had a value of 52 at press time. However, RSI has cut through the neutral line multiple times in the past few days. This indicated choppiness and a lack of trend for ADA.
In a video update, Charles Hoskinson stated that the migration on the Bittrex exchange was almost complete. He also rejected rumors that BitMEX was delisting Cardano, that it was “in fact, its quite the opposite. People have been listing us, like Bitfinex.”
IOTA

Source: IOTA/USD on TradingView
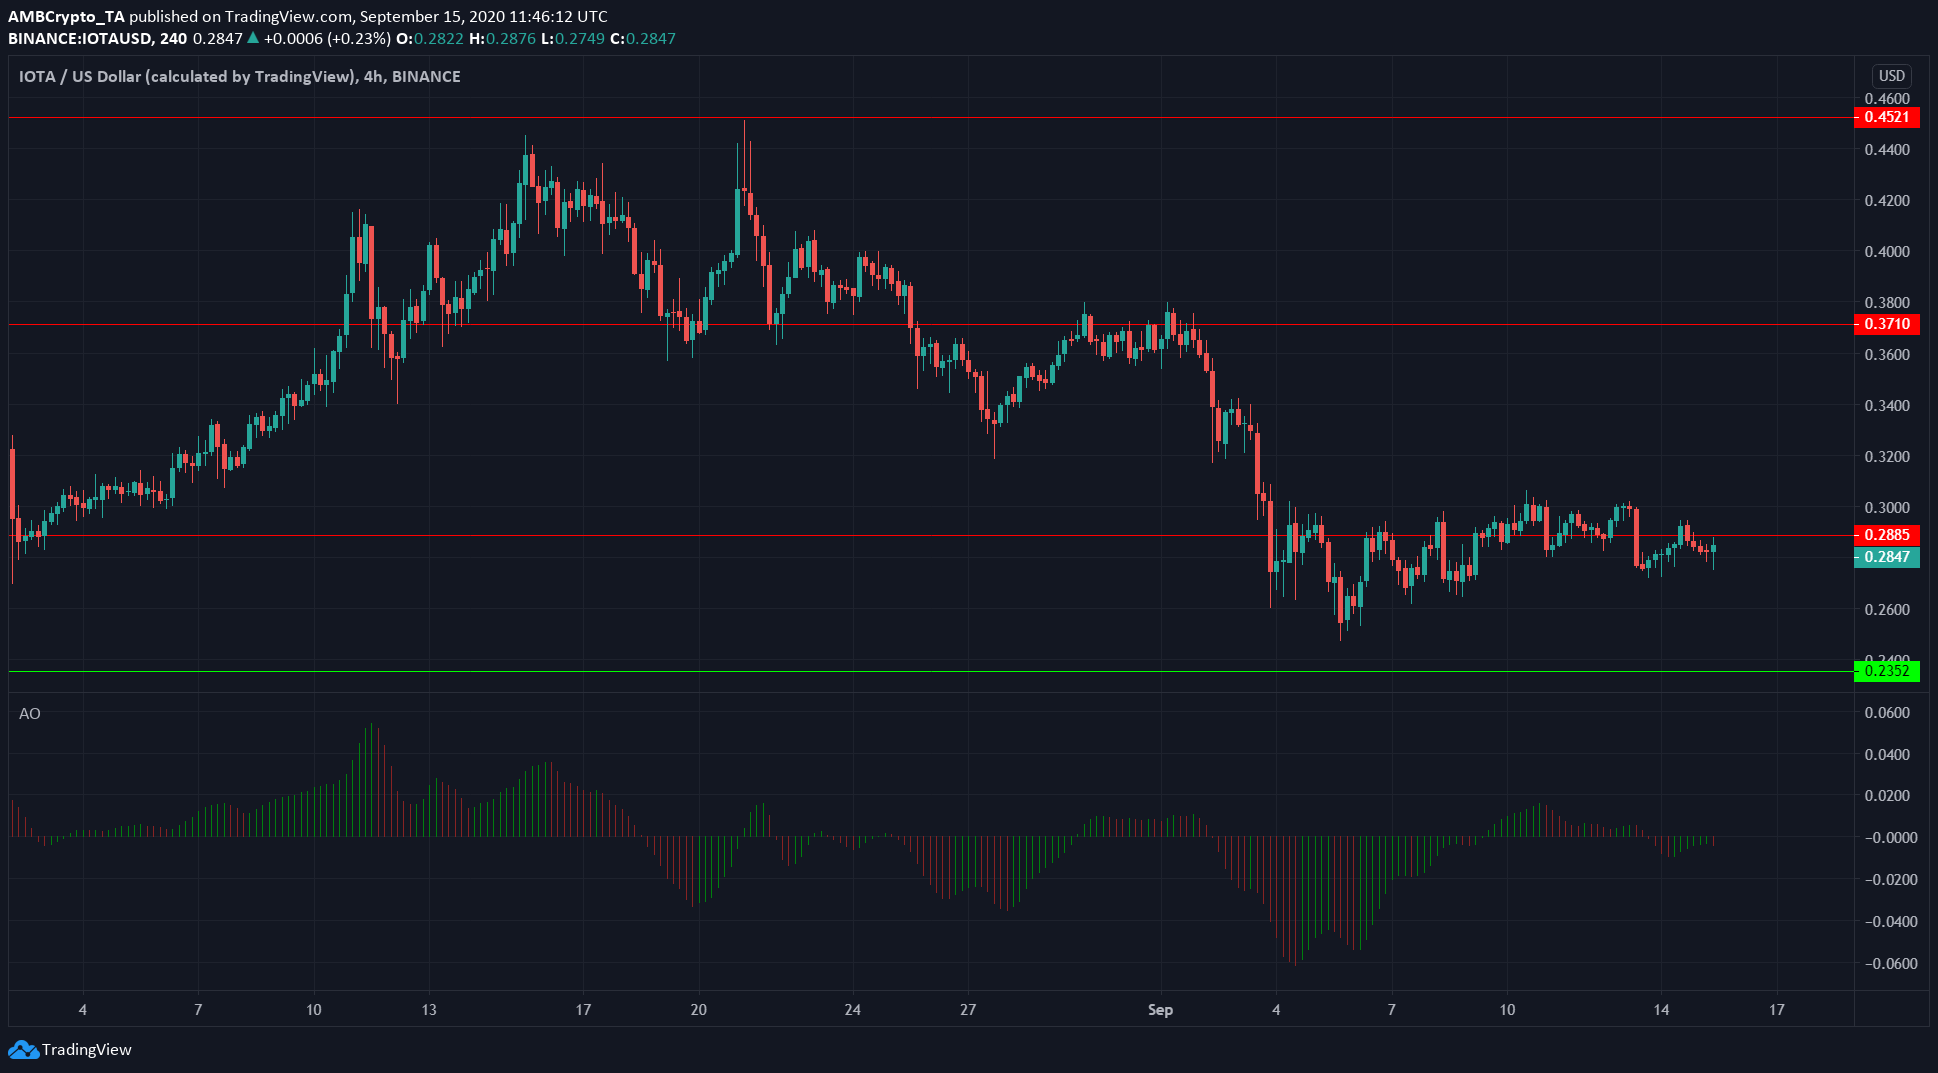
IOTA closed a trading session above resistance at $0.288 twice in the last couple of days but had failed to hold above the level both times.
Awesome Oscillator showed weak bearish momentum for the coin.
The resistance has been tested multiple times recently, and each time IOTA has formed a higher low. Buyers stepped in even when the price was so close to resistance, indicating a likelihood that IOTA can flip the level of resistance to support shortly.
Algorand [ALGO]

Source: ALGO/USD on TradingView
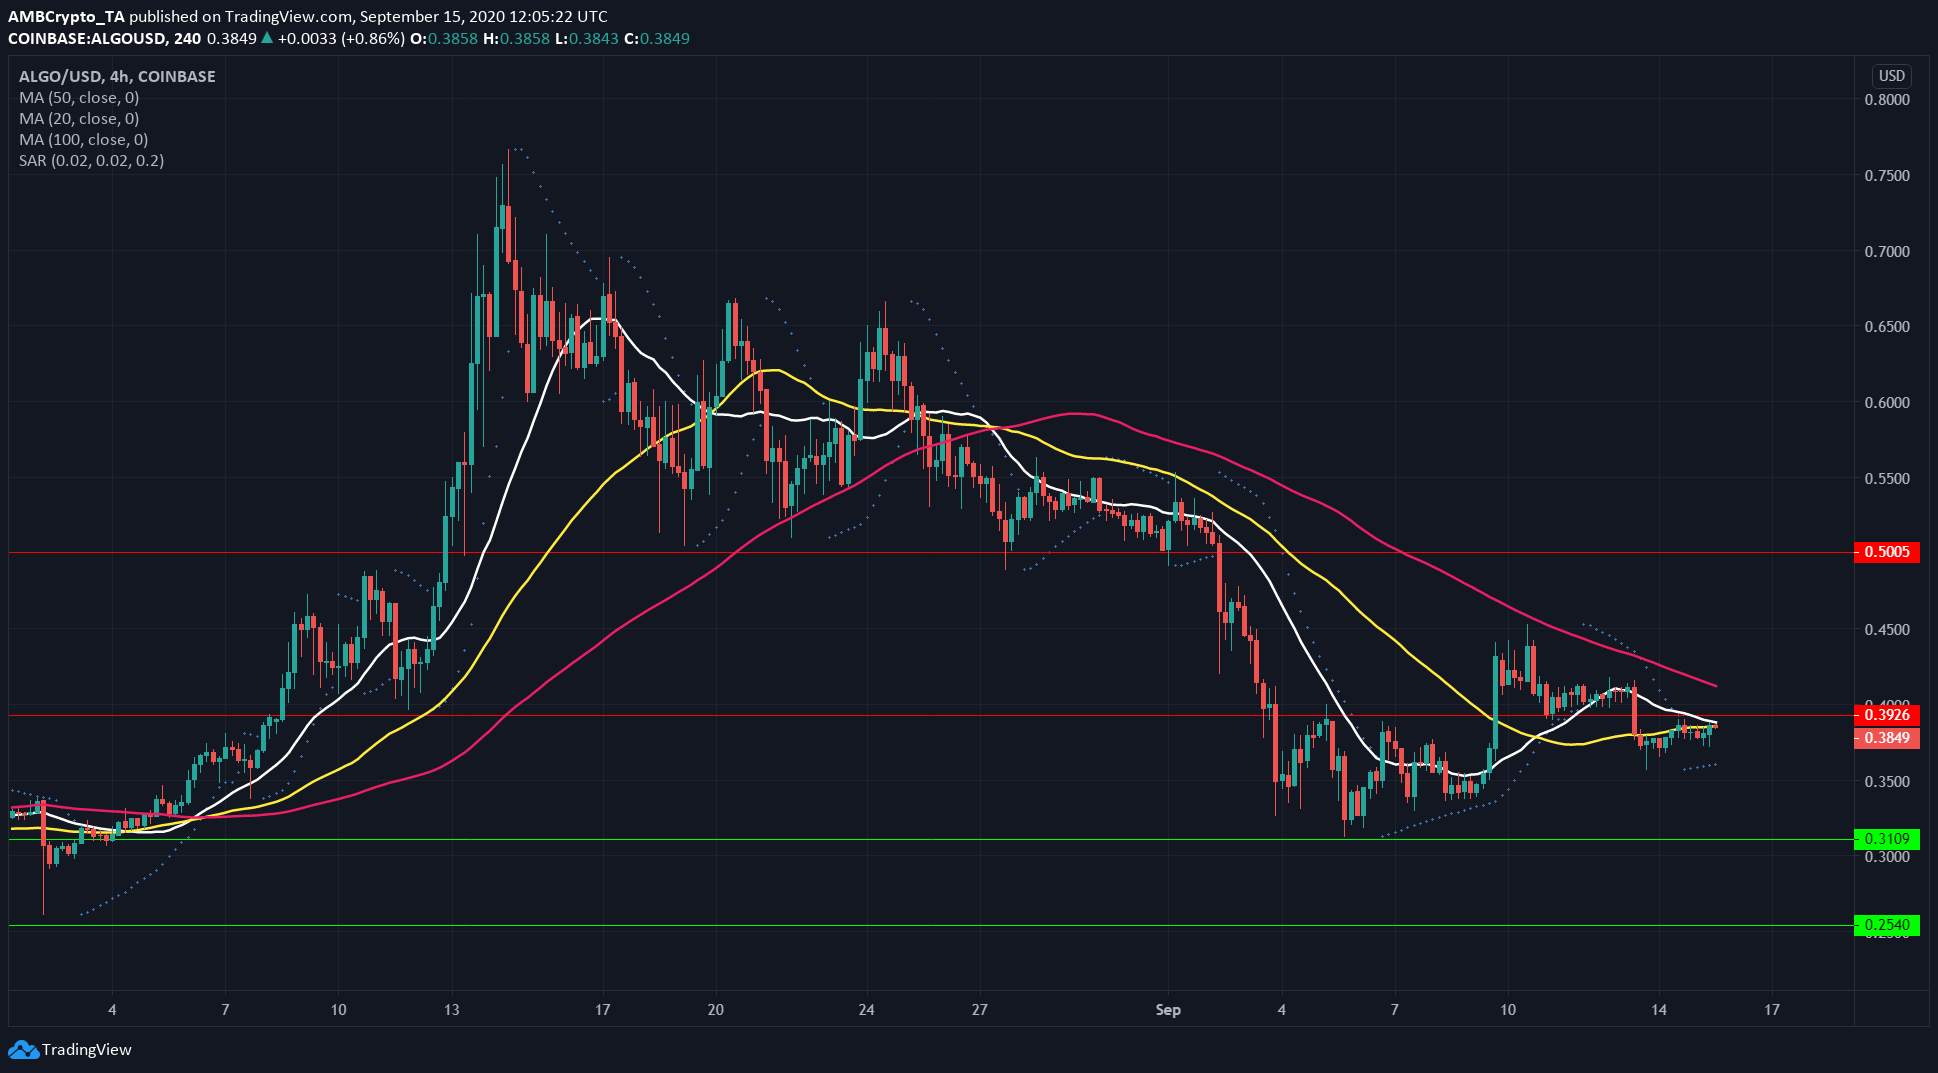
20 SMA (white) threatened to cross beneath 50 SMA (yellow) to show bearishness in the near-term. ALGO was valued at $$0.38, trading beneath resistance at $0.39 level.
Parabolic SAR gave a buy signal, however, the price faced resistance from its moving averages as well $0.39 level. A move beyond these levels would see further resistance at 100 SMA (pink).
A move beyond 100 SMA could spark an uptrend. If the price is unable to reclaim the imminent level of resistance as support, it could be headed for a drop.


