
Cardano continued to record losses as it fell below crucial support levels. While Filecoin remained neutral after it recorded low volatility on its charts. Further, Ethereum Classic too was seen entering a bearish setup, with its technical indicators also depicting strong sell sentiment on the trading charts.
Cardano [ADA]
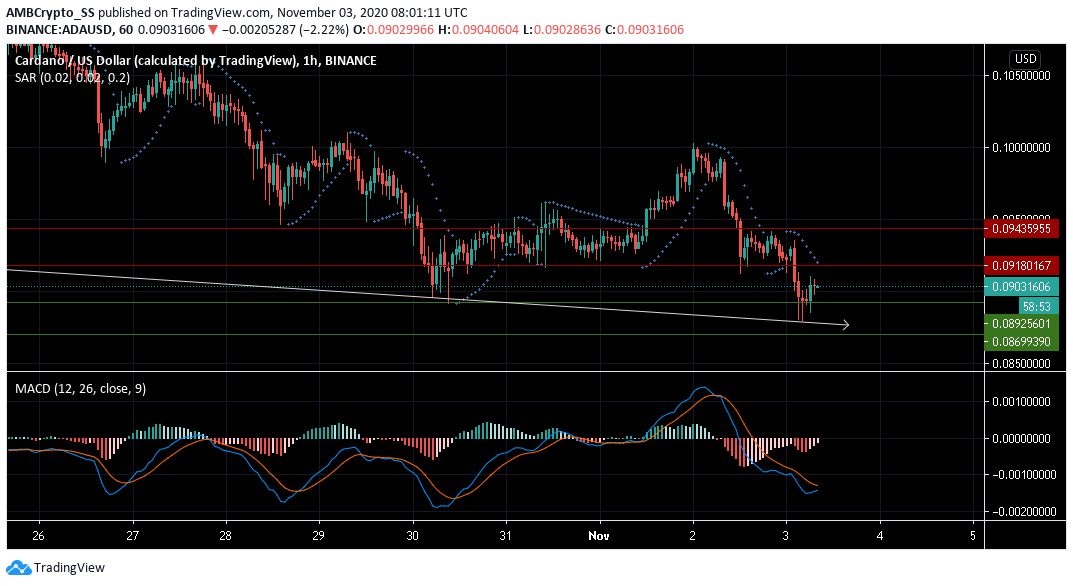
Source: ADA/USD on TradingView
At the time of writing, Cardano registered a market capitalization of $2.86 billion and was ranked 11th on Messari’s charts.
The MACD on Cardano’s charts was presenting a bearish signal as the MACD line dived below the Signal line.
Further, the placement of the Parabolic SAR’s dotted lines above the price candles also pointed to a downtrend on the charts.
With over 5% in losses since yesterday, if this latest downward price action gathers more selling momentum, Cardano could be expected to further lose support at the $0.089 support level.
Filecoin [FIL]
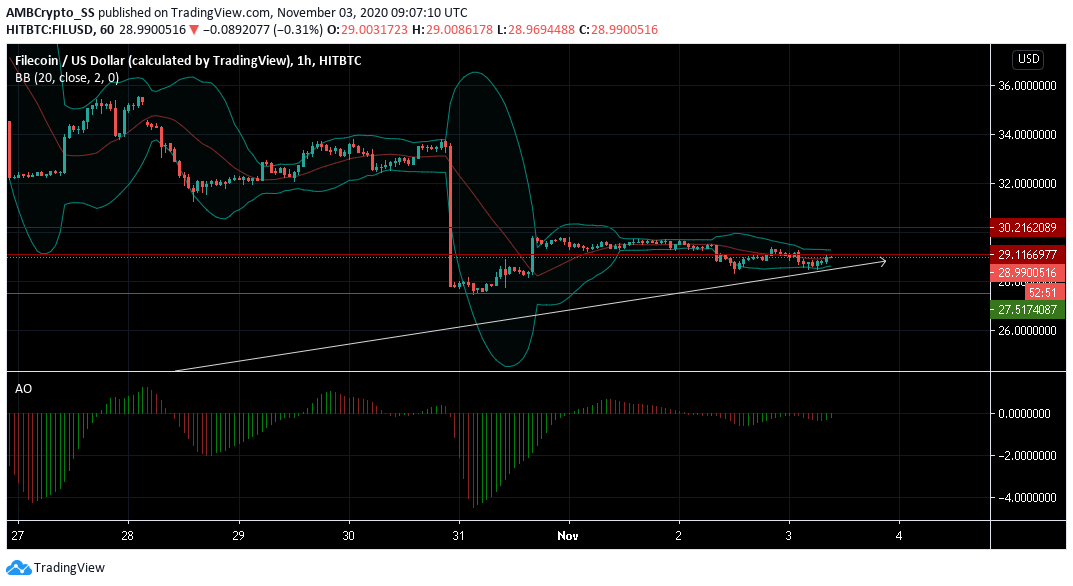
Source: FIL/USD on TradingView
At press time, Filecoin was trading at a price of $29.02, with the cryptocurrency registering a sideways price consolidation on the charts.
In fact, the cryptocurrency’s price-maintained stability along its immediate resistance level at $29.11 over the last 72 hours. The Awesome Oscillator also remained neutral, supporting a flat price movement.
The convergence noted by the Bollinger bands pointed to a low volatility level on the charts.
While the overall price trend continued to be on an uptrend, price levels for the short-term period were seen treading sideways along the median band.
Ethereum Classic [ETC]
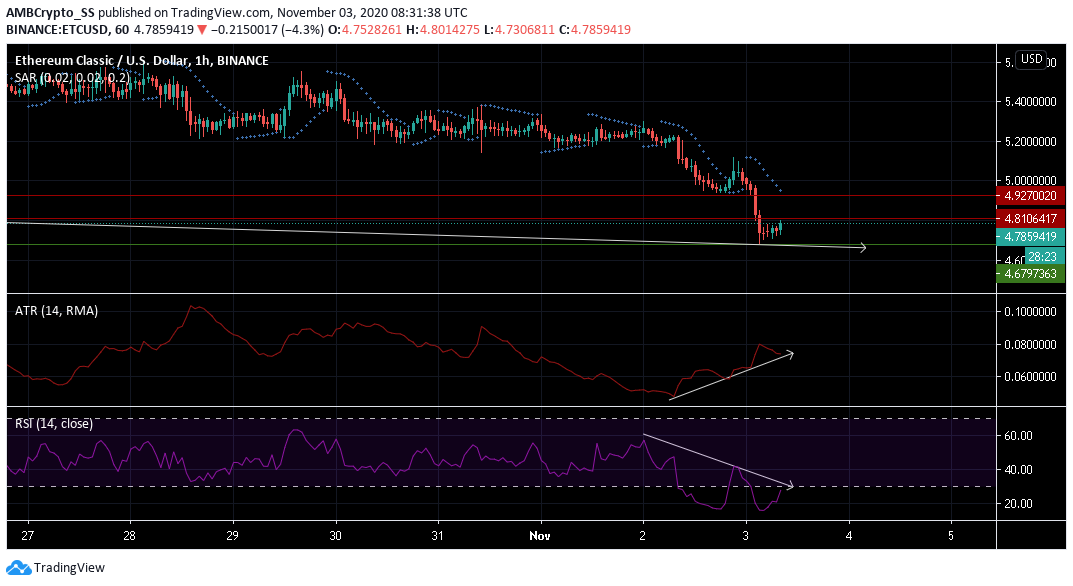
Source: ETC/USD on TradingView
During the previous week, Ethereum Classic had been trading above the $5.2-mark. However, a bearish market momentum witnessed just yesterday, soon pushed the price towards its immediate support at $4.679
The Average True Range (ATR), a technical indicator measuring market volatility, also pointed to a noticeable rise in the volatility levels during the last 24 hours.
The single-day spike in ATR coincided with a sharp fall witnessed in the Relative Strength Index (RSI) as it fell from the 60 level, right into the oversold zone.
This was a clear indication of a sudden rise in the selling pressure seen in the ETC market, which was further confirmed by a downtrend underlined by the Parabolic SAR.