Bitcoin‘s Crypto Fear & Greed Index is showing a massive shift in the top coin’s narrative and hence the whole crypto ecosystem. The FG index which was in extreme fear has now started to surge and this increase signals a shift in the market from extremely bearish to slightly bullish.
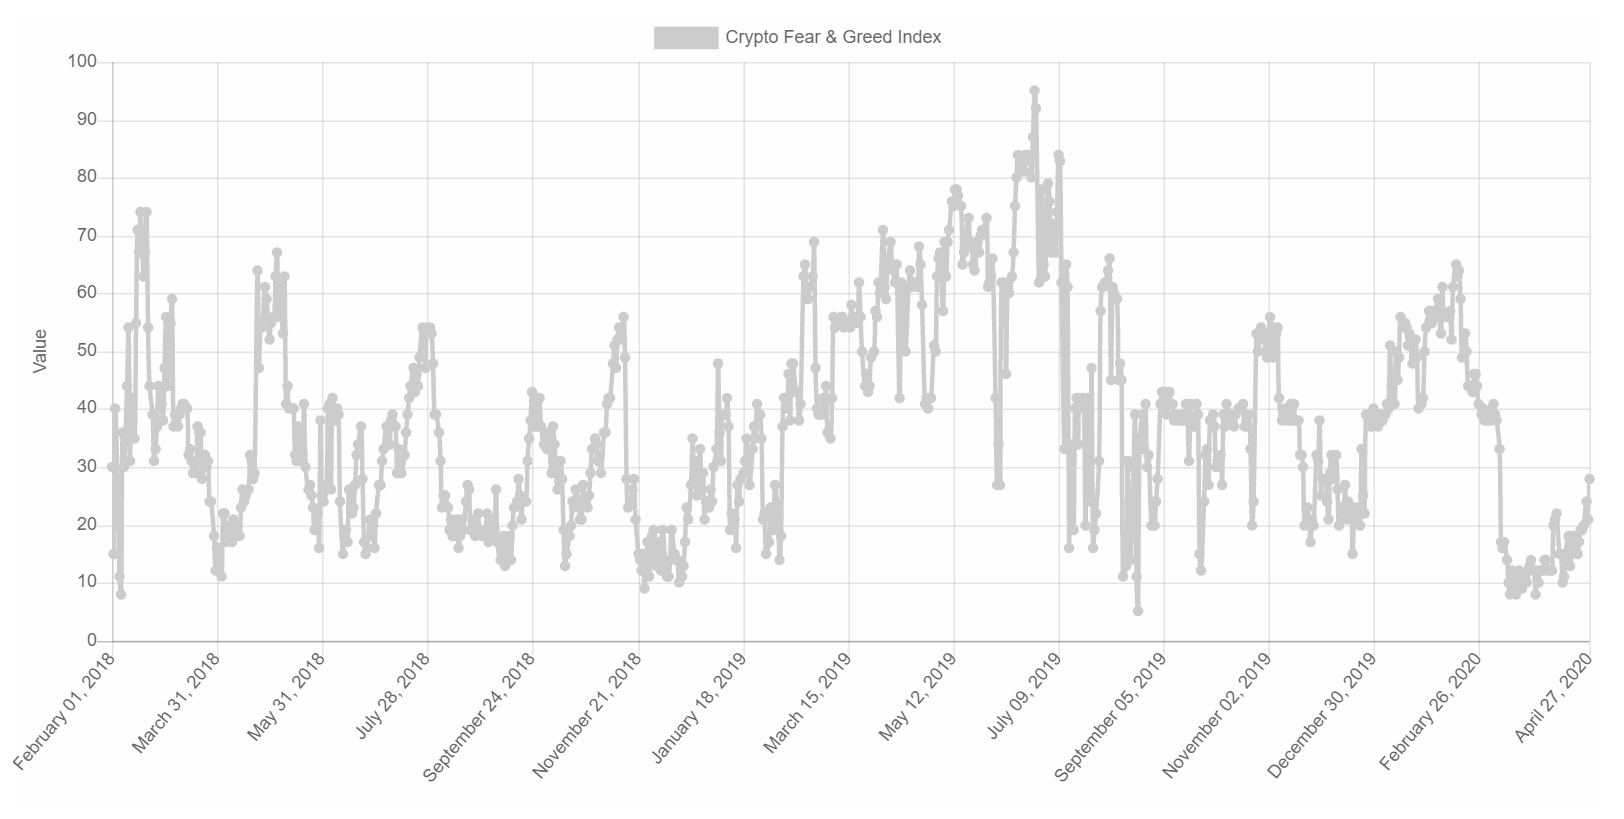
Source: Crypto Fear & Greed Over Time, alternative.me
As seen in the attached chart, FG index had dropped to 8 following the March 12 crash, and this was the second-lowest dip seen since Feb 2018. The lowest FG index’s dip ever seen was in August 2019 when it had dipped to as low as 5.
What’s the reason for the recent dip?
Following the onset of COVID-19 pandemic, BTC, although it is supposed to be an uncorrelated asset, crashed down by 50% following the same pattern as other traditional assets. This sell-off created a sense of panic in an already tense environment. However, the surge now means the faith in the coin is being restored.
But why’s there a surge now?
Since 2017, BTC has not had another high. The coin which is in the extended bear market is started to surge now. It’s time for Bitcoin to start surging again.
Another major reason for this surge is the upcoming halving. As observed in the previous two halvings, BTC has recorded an increase in price just days before the halving. People are investing now assuming that the coin would follow the same pattern as the previous halvings. Additionally, other fundamentals of bitcoin like the hashrate are also in sync with the rising FG index; Bitcoin’s hashrate at press time was at 113.19Eh/s.

Source: Bitcoin Halving chart, TradingView
The red lines in the above chart indicate miner capitulation. Miner capitulation is when smaller, non-industrial mining firms stop operations when they can’t bear the expense; they also sometimes become technologically obsolete. It can be noticed in the chart that miner capitulation was seen after the halving, during 2012 and 2016. However, capitulation has happened twice before the third halving. Now that Bitcoin’s price has recovered from the March 12th dip along with a recovery in the hashrate, a slight shift is seen from the red bands to the blue bands in the hash ribbons.

