
Ever since the unfortunate drop on September 25, Bitcoin managed to form higher highs indicating an uptrend in play, however, the daily price candle formed on November 7 put this uptrend to a standstill and induced a downtrend. Additionally, this downtrend has put the price of Bitcoin below the 200-day MA indicating a future infested by bears.
Daily Chart
A volatility induced spike was awaited since the price had formed a continuation pattern [or pennant] as the price hovered around $9,200. The spike came to life on November 8 as the daily candle collapsed a total of 6.40% on Bitstamp and the price, at press time was $8,800.

Source: BTC/USD TradingView
The breakout of the triangle could lead to more downside for Bitcoin since there isn’t strong support between the current price and $8,400 to $7,900 range. Adding to this bearish scenario is the 200-day MA, which has been breached by the price second time in over 45 days. On a daily time frame, one price candle has closed below it indicating confirmation of the incoming bearish trend. Factoring in the 50-day MA indicates that the death cross is in play.
Moreover, the volume profile shows strong supports in the $7,900 range, in the vicinity of the 0.5 Fibonacci level. Breaching this would cause a waterfall drop to $7,300 and $6,300.
The Relative Strength Index [RSI] indicator also shows an opening that could push the RSI below 50 and possibly in the lower 40 levels, causing a decrease in the buyer momentum.
Volatility

Source: BitVol.info
The 30-day volatility of Bitcoin has reached ~4% which was last seen more than six weeks ago. Days before the unfortunate drop, the volatility of Bitcoin had reached a low of 2%, half of what was seen today. There is a chance for volatility to climb as high as ~5% indicating further violent moves for BTC in the near future.
Weekly Chart
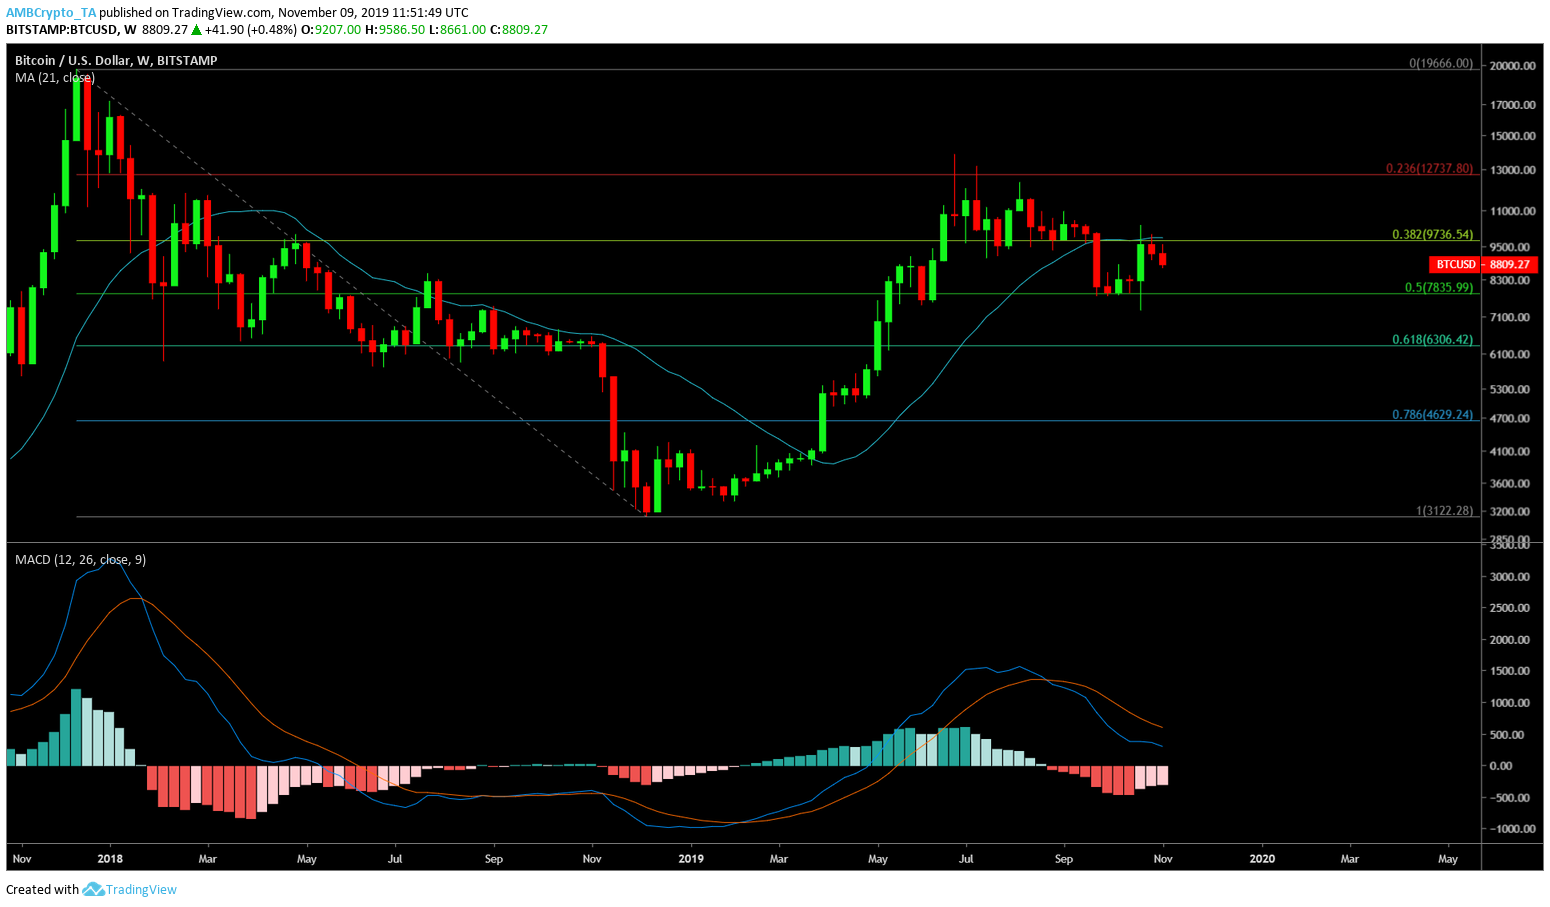
Source: BTC/USD TradingView
A 16% lush green weekly candle was followed by two consecutive red candles [if the present week closes red] as it was rejected at 0.38 Fibonacci level [$9,700]. This signifies a change in trend swaying towards the bears. The only logical move is the continuation of this trend until $7,800 is achieved which also happens to be the 0.5 Fibonacci level as mentioned above.
Moreover, similar to the 200-day MA, the 21-week MA has also prompted a bearish signal as the price has crawled below it after being rejected on October 21.
The weekly MACD indicator showed a continuation of the bearish crossover with the formation of red candles in the histogram.
Conclusion
The daily and the weekly charts for Bitcoin indicate an incoming bearish attack as confirmed by the daily RSI and the weekly MACD indicator.
The price for BTC shows possible stops at the following levels.
- $8,400 to $7,900
- $7,300 and $6,300
Although the second range, $6,300 seems unlikely, it is a longterm target and will take more than a few weeks. However, the bears are taking over Bitcoin in the short term and it is evident considering all the bearish signals have lit up like fireworks against the night sky.