Bitcoin’s descending channel predicts a rise to 9K by the end of the month

The drop in Bitcoin’s value during the final third of September was a blow to many a Bitcoin maximalist’s confidence. There were those who thought that the cryptocurrency would never dip below $10,000 again – until it did. But hope is not lost, as the 12 and 24-hour charts could be suggesting a bullish market in the near future.
Bitcoin was valued at around $8350, at press time, with a daily trading volume of $19.3 billion and a market cap of over $150 billion. It also recorded a 1.6% drop over the past 24 hours, according to CoinMarketCap.
BTC 12-hour chart

Source: BTC/USD on TradingView
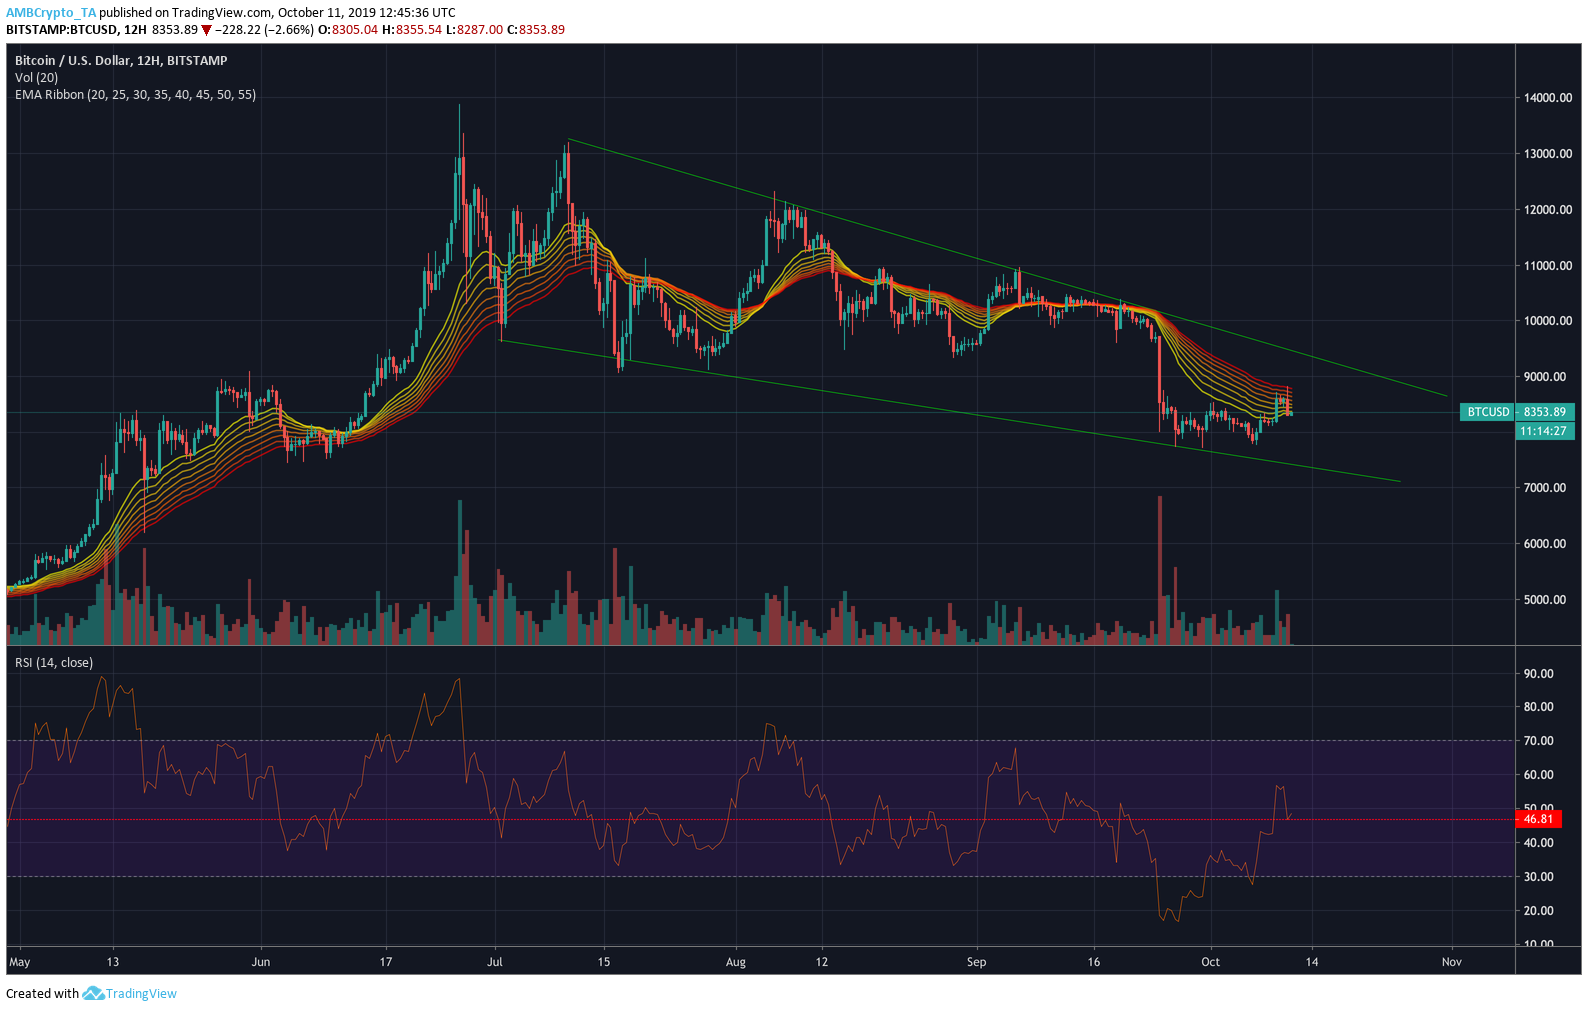
The 12-hour chart for Bitcoin against the U.S. dollar showed that the price trend entered into a falling wedge pattern in early July. The decreasing volume trend since then also suggests that the trend is following this pattern, for which the breakout usually tends to occur upwards.
With the EMA ribbon lines being cut through by the last few candles, it looks like Bitcoin could be in for a bullish market. The fact that the ribbon lines could be moving into a mean reversion is further evidence of an increase in value soon. A look at the Relative Strength Index indicator shows that there isn’t any dominating pressure between buyers and sellers, with the line moving very close to the median value. It also looks to be testing support at the 46 mark, from where it will likely bounce up as a more buyers’ ride.
Daily chart

Source: BTC/USD on TradingView
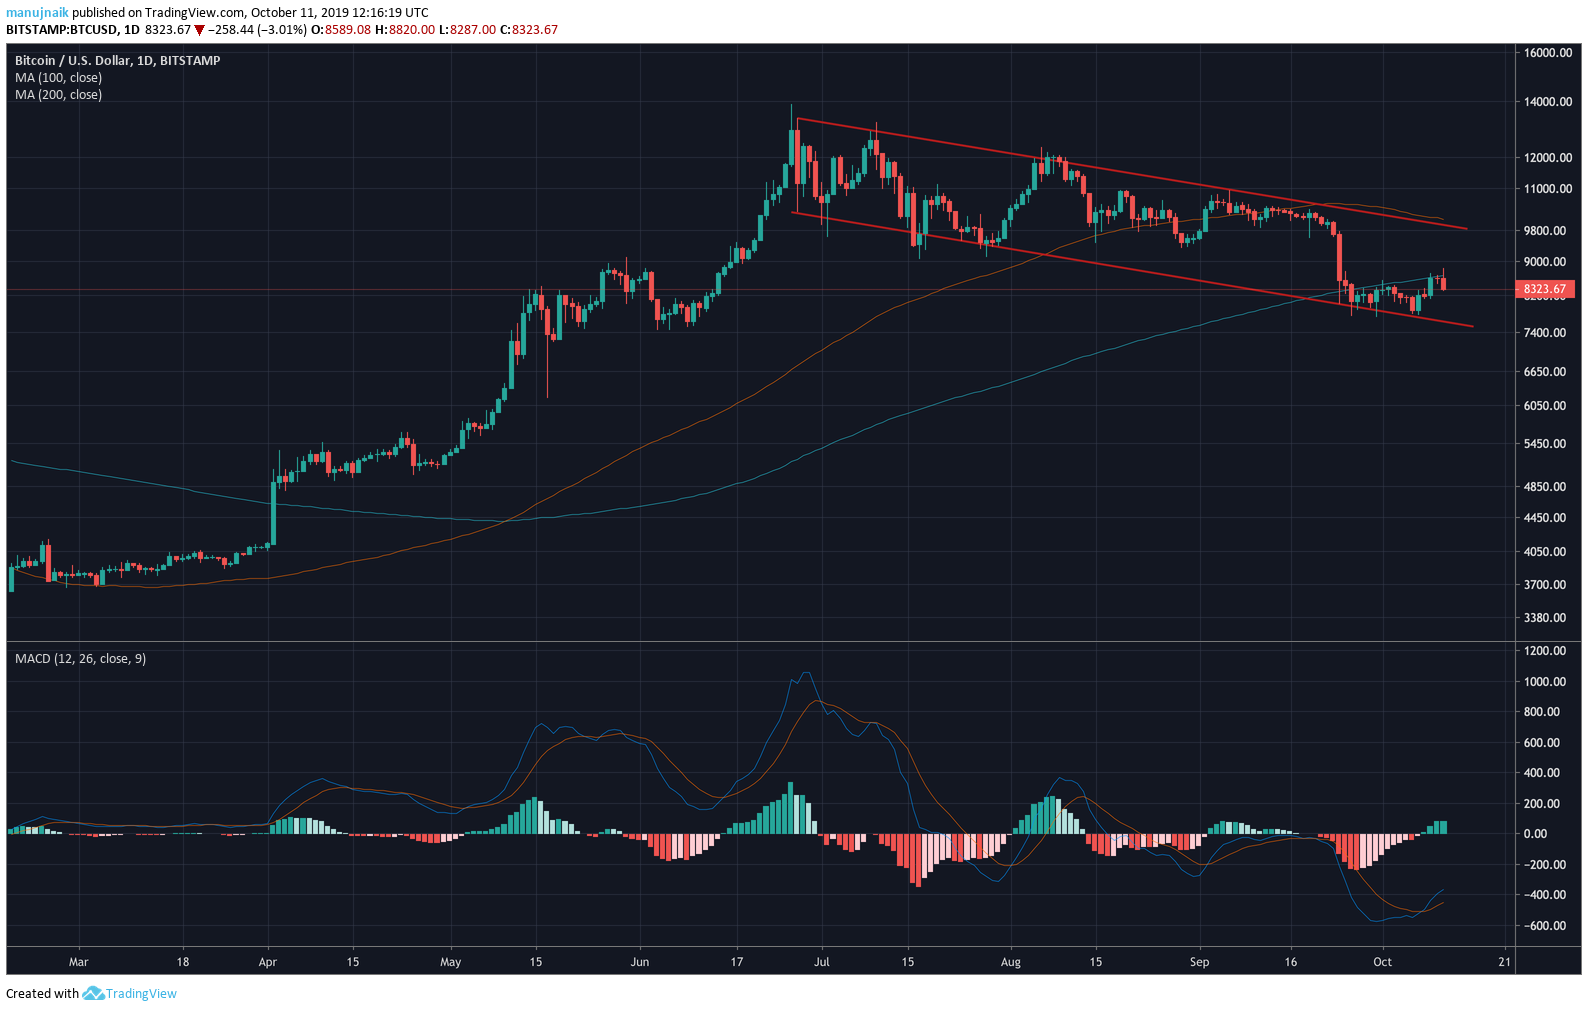
The daily chart’s price trend shows more of a parallel channel, with the 200-day moving average likely to cross under the price trend as Bitcoin moves up further. With the signal line having crossed under the MACD line, it is highly likely that Bitcoin will rise in value over the coming weeks, possibly up to $9000 by the end of the month.
While it cannot be certain when the breakout will occur, Bitcoin is in for a rise in value this month. And though it could even take months to finally breakout, it is likely to soar above $13,000 when it does.


