Analysis
Bitcoin’s consolidating price may rise momentarily with breach of ascending triangle
Bitcoin’s price has been consolidating since the last bull run, however, short-term charts for the coin indicate spurs of bullish outburst as the coin awaits breaching of a bullish pattern, followed by a correction.
Bitcoin pulled itself out of the $9,800 hole and, at press time, was valued at $10,340.86. It reported only minimal growth of 0.10% over a day, but as price consolidates the valuation may shoot up in the shorter term before reporting a correction.
1-hour

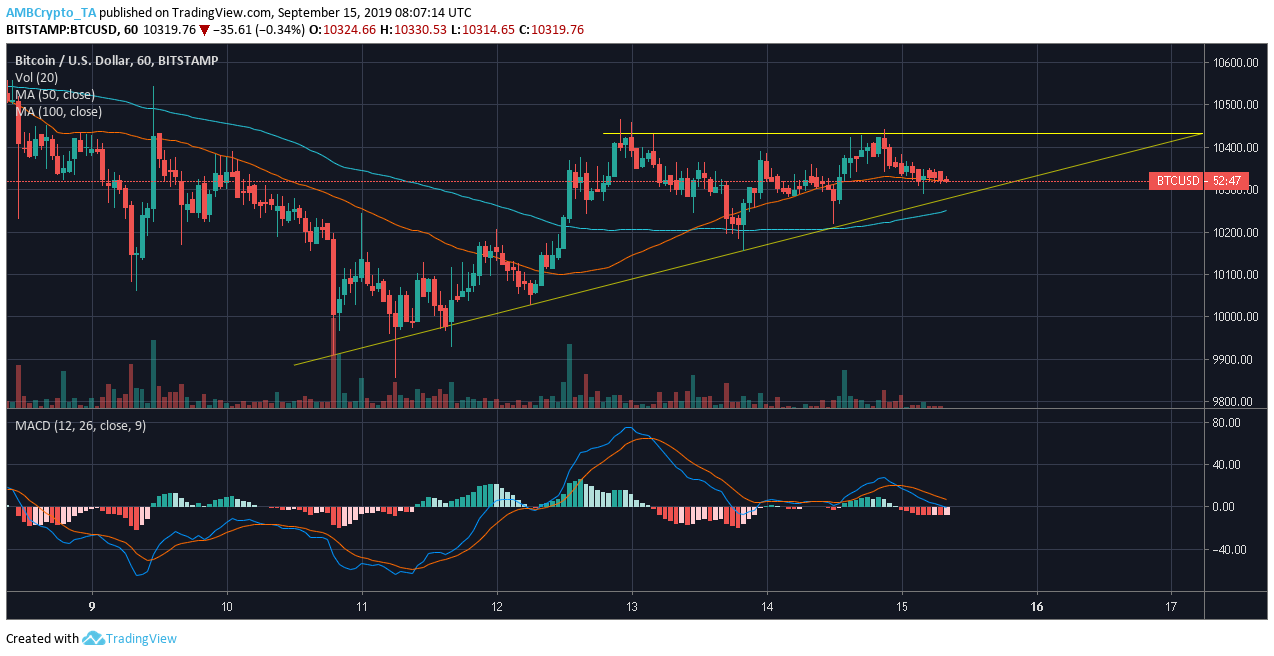
Source: Trading view
1-hour chart of Bitcoin noted formation of an ascending triangle pattern. Horizontal line marked swing highs at $10.432.87, while rising trendline was drawn along swing lows at $9,912.64, $9,975.06, $10,028.24, and $10,153.10. The pattern which is also considered as a continuation pattern might see a breakout as the price further consolidates.
50 moving average overtook 100 moving average, showing signs of a bullish market. However, MACD line was resting under the signal line signifying a bearish trend. Thus, the coin may report some growth over time, but the bears are not far.
4-hour
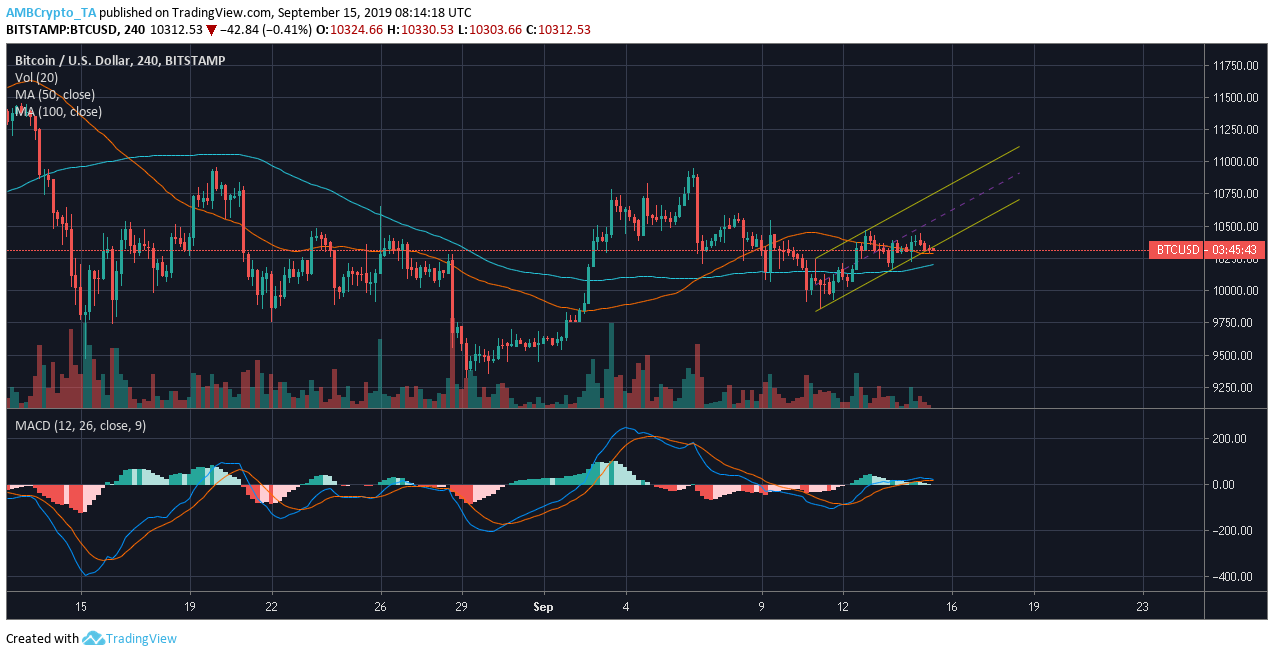
Source: Trading view
The 4-hour chart of the coin recorded formation of an ascending channel, conceived as a bearish sign. Price of Bitcoin has been contained between two upward sloping parallel lines. The higher highs are connected by one trend line at $10,218.72 and $10,466.89, while the higher lows are linked by another trend line at $9,854.20, $9,924, and $10,156.67. The price of the coin might take a hit if the coin were to move further in this channel.
Current market appears bullish as MACD line paused over the signal line and 50 moving average placed itself above the 100 moving average.
Conclusion
Bitcoin’s price might rise with the breach of the ascending triangle but may fall after the breach of the ascending channel.


