
Bitcoin’s ~10% pump on 14 January got most of the community excited since it brought BTC very close to $9,000. Round figures like $9,000, $10,000, and even $6,000 have been important psychological levels and are held in high regard. However, while Bitcoin hit the $9,000 level on 17 January, it failed to cross above it. Nonetheless, January is generally touted by many to walk one of the extremes – very good or the opposite.
Bitcoin’s Monthly performance
At the time of writing, Bitcoin was still trying to recover the gains it lost after 2017’s euphoric boom cycle ended. Since then, the price has traversed the depths of $3,322 and the highs of $13,800, while failing to surpass 2017’s highs. This elongated time between cycles can be used to look at the monthly performance of Bitcoin, especially for the month of January.
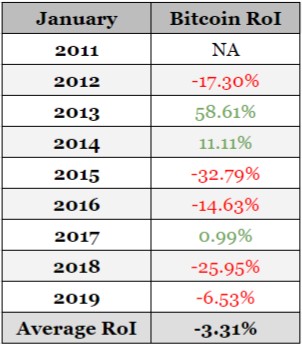
Bitcoin’s profits over the years have varied, each month, each quarter. Looking closely, it can be seen that the returns in January started to follow a trend from 2015. Will this year yield a different result?
The month of January has yielded an average overall profit of -3.31%, indicating that things usually tend to go south in the month of January. Due to a lack of Bitcoin price data in 2011, the data set used to look for a trend starts in 2012. January has yielded profits only 3 out of 8 times, and the lack of profit can be explained by looking at Bitcoin’s cycles, their trend, and the duration.
Boom-Bust Cycles of Bitcoin
Bitcoin’s surge, as seen from 2012 and 2013, were quick; so were its corrections aka bear cycles. This started to change as Bitcoin passed each year. The surge from $2 to $7 in 2012 took only 51 days, while the collapse from $7 to $4 took only 32 days. The next rally that took BTC to a new ATH of $14 happened in 180 days from the previous bottom ($4).
Similarly, the next ATH of $230 took 235 days from its previous peak or 230 days since its last bottom. $230 to $1130 in 2013 took nearly 235 days, however, the bear market for this peak lasted for over 409 days, where Bitcoin bottomed at $170.
The start of 2014 through the start of 2017 was a slow and steady rise to recapture the previous high of $1130. However, once this was breached, Bitcoin surged exponentially, hitting $20,000 by the end of 2017. The bear market that started in 2018 is still upon us, and the long-term outlook for 2020 seems like the year when Bitcoin would recapture its previous highs and perhaps. start another rally, by the end of 2021.
However, the short-term approach is the month of January and its importance. Bitcoin follows an unusual trend that has been occurring since 2012, but has become more pronounced only in 2015. The trend is clearly visible in the chart seen below.
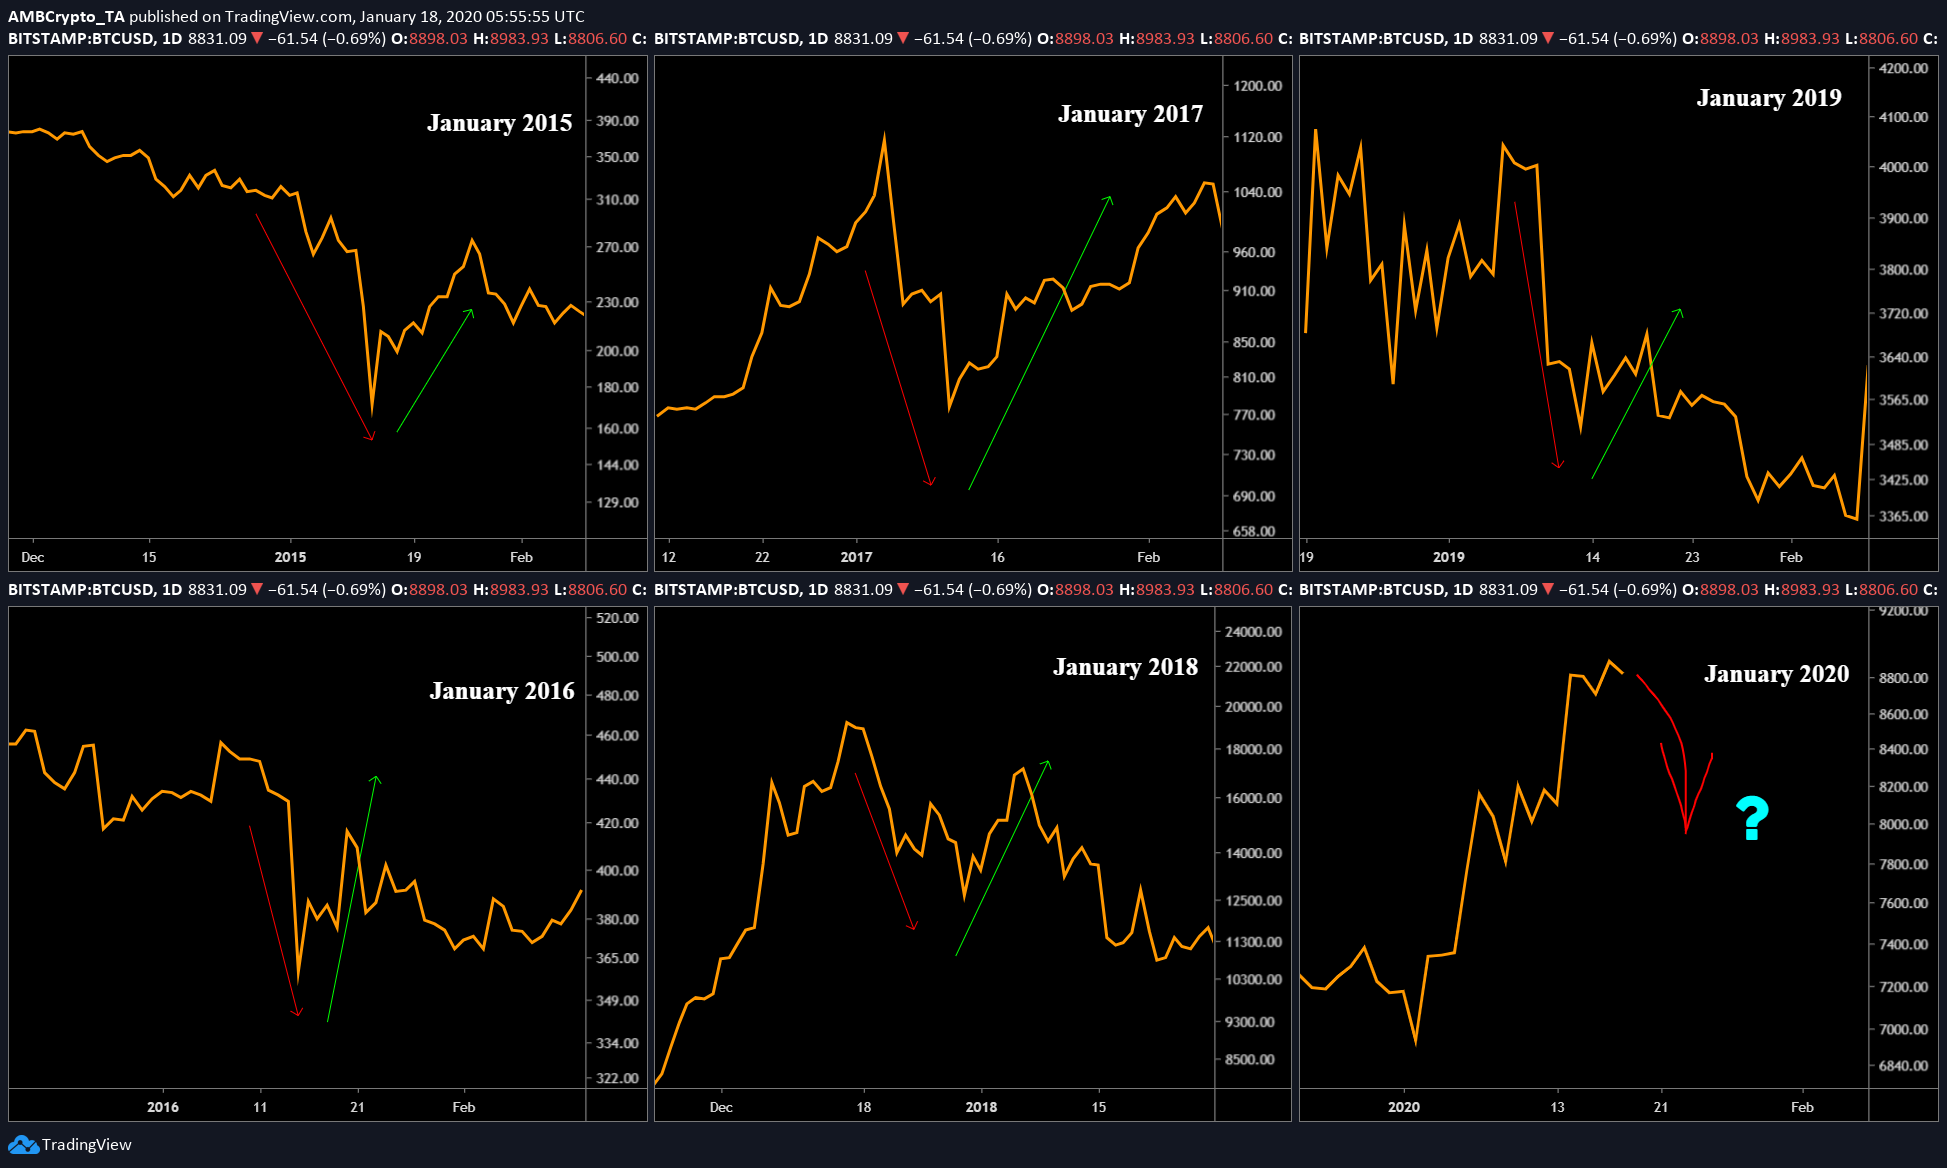
Source: BTC/USD on TradingView
As it stands, January is halfway through and the trend is yet to evolve. However, if one were to assume that the trend will repeat itself, then a dip needs to be expected in the next few days.
AMBCrypto spoke to a few crypto-traders about this trend, all of whom came to, more or less, the same conclusion that this might be something of an anomaly and that it might not happen. One trader commented, “anything outside of his trading data is just a gamble with unknown odds.”
The other trader, however, said that there is “definitely a chance” of it occurring.
Regardless of traders’ opinion, the technicals for Bitcoin also indicate a bearish scenario in the imminent future. On 17 January 2020, Bitcoin recaptured a highly important psychological level of $9,000. More precisely, Bitcoin’s failure to stay above the 200-day MA seems to be the first hint that a downtrend might be incoming, especially since the 200-day MA is considered to be a trendsetter.
History doesn’t repeat itself but it often rhymes.
Models and trends are built using past data. Hence, in hindsight, they might look perfect, but there is no assurance that an asset might obey the model in perpetuity. Yet, with recursive logic, the price action might cause the trend to unfold and undergo a similar pattern. Hence, there is an equal chance of things playing out for Bitcoin. Moreover, fractal formations of such kind are seen more often in Bitcoin; it is a natural phenomenon where a publically traded asset tends to exhibit repetitive patterns.
These patterns can occur over different timeframes and at different scales; some of these fractals might play out exactly like the ones before it. Such fractals allow huge upsides if utilized correctly. There are fractals that do not play out until the very end and hence, they could spell disaster without proper risk aversion methods.
In ten days, the first month of a new decade will come to an end and the recent collapse in Bitcoin’s price might indicate a repetition of events witnessed since 2015.