Disclaimer: The findings of the following article should not be taken as investment advice as it is the sole opinion of the writer, and the same should materialize over the course of this week
Dealing with the weight of a bearish onslaught at press time, Bitcoin SV declined below crucial support lines on the charts over the past few days. The crypto-asset ranked 9th on the charts, at the time of writing, had a market cap of $3.1 billion, with BSV valued at $167. Over the past 24-hours, however, BSV has registered some form of recovery. Alas, uncertainty regarding the crypto-asset’s long-term and short-term future still prevailed.
Bitcoin SV 6-hour chart
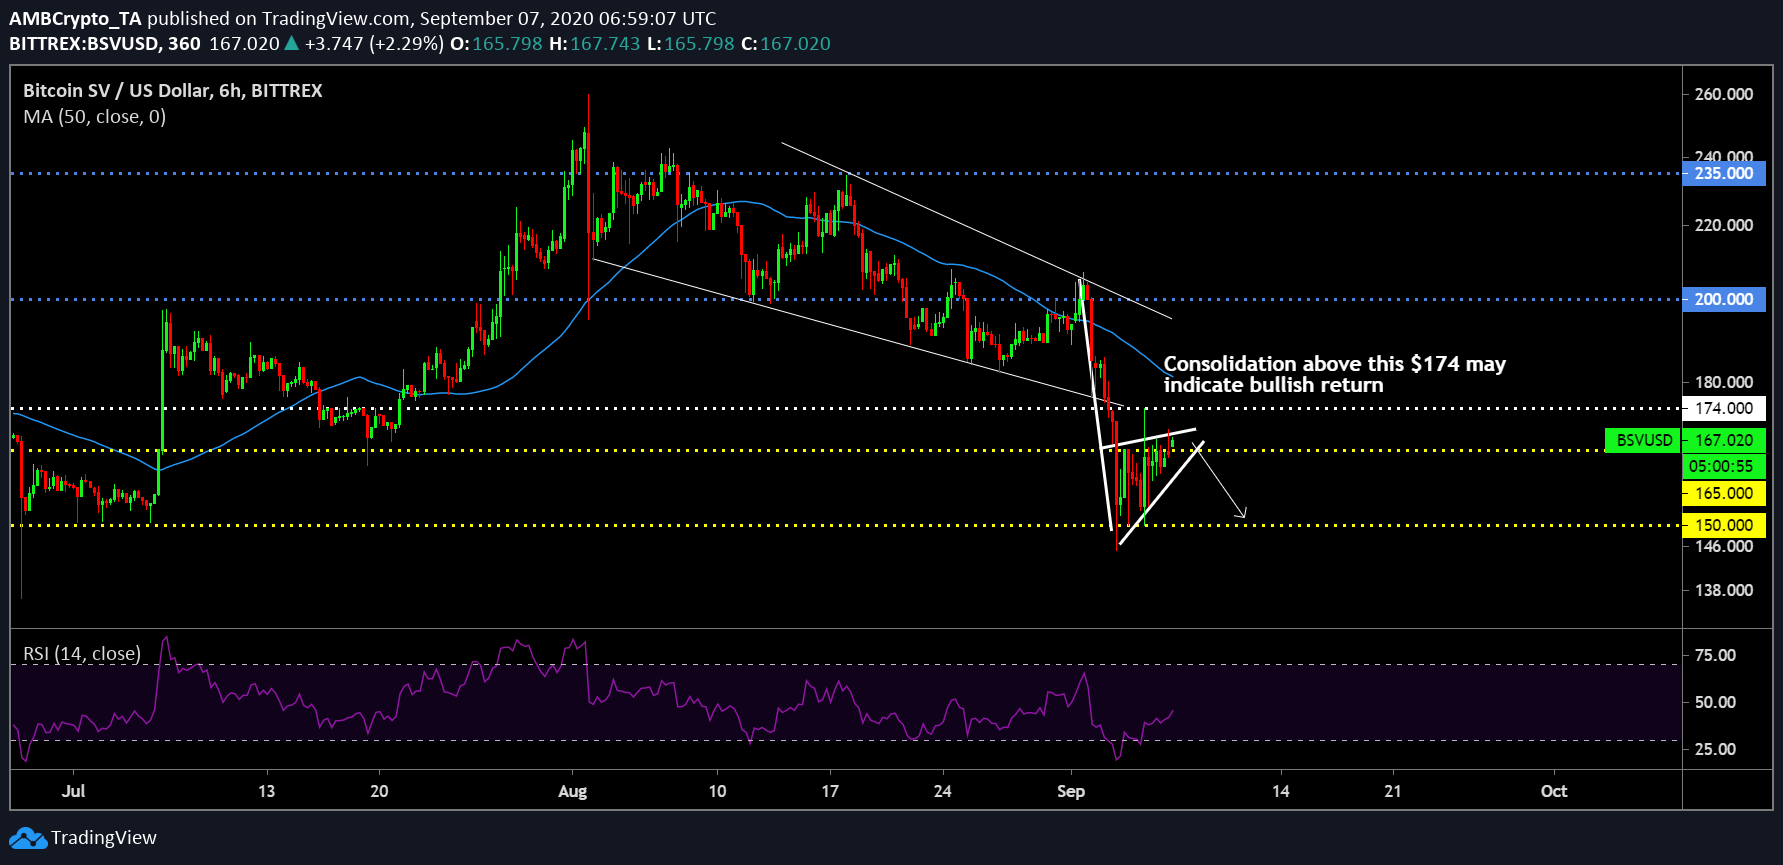
Source: BSV/USD on TradingView
Before the recent collapse unfolded on the charts, it is important to note that Bitcoin SV was oscillating between a falling wedge pattern. The pattern is usually indicative of a bullish breakout, but this one did not follow its usual norms and the price fell below its immediate support at $174. However, the collapse did not stop there as support as the $165-level was broken as well. Over the past couple of days, BSV managed to consolidate above $150 and at press time, was pointing towards a return above the $165-mark as well.
However, before suggesting any bullish move right away, the fact that a rising wedge pattern is taking place suggests that another drop below $165 is fairly possible. Going ahead, a significant bullish sign would be if the asset is able to take back a position above $174 and maintain consolidation for 24-hours. With the Relative Strength Index or RSI nursing a recovery, early signs are positive, but far from confirmed.
Bitcoin SV 1-day chart
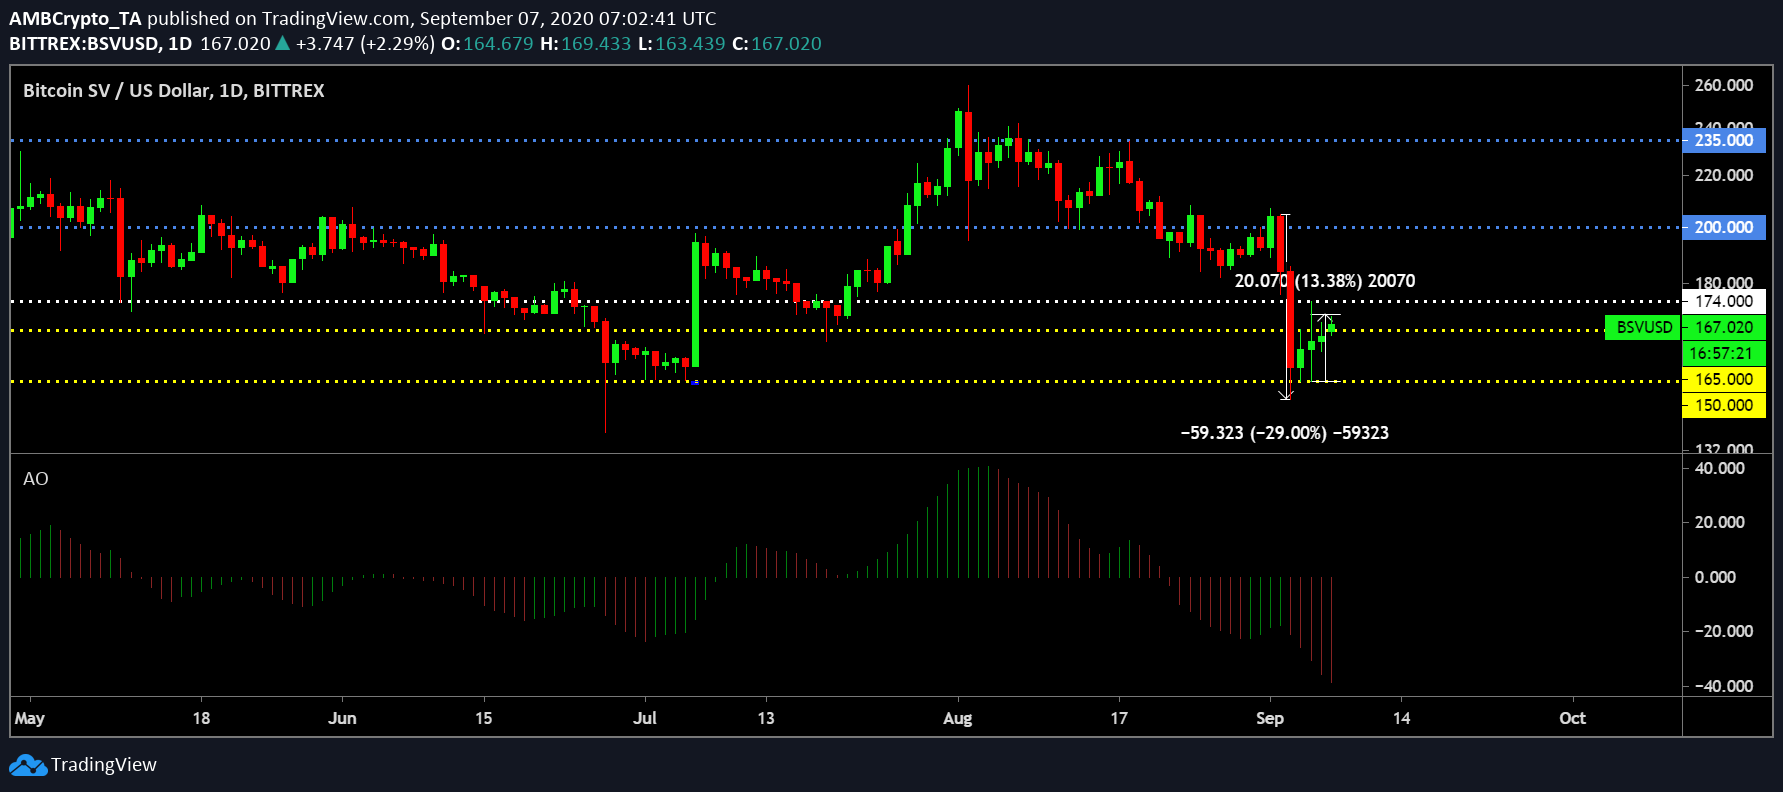
Source: BSV/USD on TradingView
One of the main reasons why the recovery over the past 24-hours cannot be taken too seriously is its percentage return after the drop. Between 2nd and 3rd September, the crypto-asset fell by 29 percent. Over the past four days, however, recovery has been worth only 13.38 percent.
Such a recovery is a regular move in a bearish trend as buyers and sellers are trying to balance the order books. If the resistance at $174 is reclaimed, the situation would dramatically change but until then, Bitcoin SV is likely to attain further correction down the charts.
Wit the Awesome Oscillator suggestive of strong bearish momentum, Bitcoin SV is likely to drop below $165 again.