Bitcoin
Bitcoin’s implied volatility dips to 2016-levels; will trading activity rise?

The cryptocurrency market has been climbing up almost every day and the market cap has also managed to recover from the 2020 lows. Whereas, the largest cryptocurrency, Bitcoin has been climbing in terms of price and was valued at over $8,400, at press time. The spot market has been witnessing buyers ramping up the price of the digital asset, as the halving nears.

Source: Coinstats
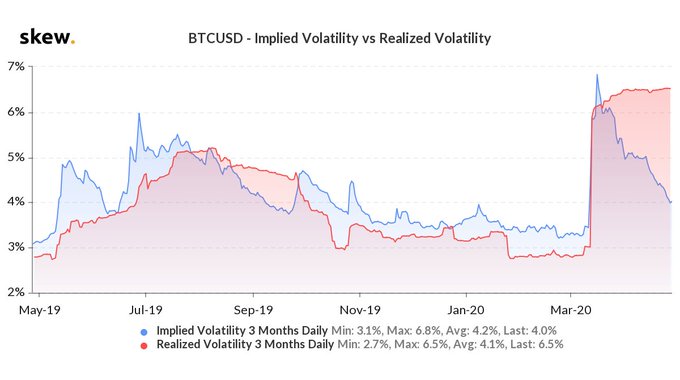
This positive sentiment among the traders reflected in the BTC volatility chart. The data provider Skew highlighted the reducing implied volatility in the market. The metric that measures the market’s analysis of the future, was reporting less volatility in the near future.

Source: Skew
Due to the violent crash in March, the price of the digital asset was slashed by almost 50%. The above chart highlighted this sudden spike, however, also noted the falling Implied Volatility. The 3-month Implied volatility has now decreased compared to the 3-month realized volatility for the data that was available. The break-even average daily move has also reduced to ~4% as opposed to ~6.5% in the past 3 months.
According to recent observations from Messari, the pre-halving volatility in 2012 has remained flat, however, 2016 volatility saw a spike.
Source: Messari
The 2020 statistics showed the sudden rise in volatility after Black Thursday sell-offs. This heightened volatility has started to take a dip and have now reached 2016-levels.
As halving approaches, the reduced volatility could be an important metric to note the positive sentiment in the market. The reduced volatility indicated that the traders were not expecting the price to see any massive changes. Due to the strong positive view of the market, the trading volume and volatility have been subdued. In 2016, the trading activity had increased during the time of halving and a similar trend might be visible this time.

