
The king coin, days after double-dipping its 100-day moving average, is chocked under the margin of $10,500. Following the massive drop from $10,800 on 6 September, Bitcoin has been rebounding from resistance after resistance and now looks to move outward.
Amid fluctuating movement, top cryptocurrency exchanges are seeing varied movement in their BTC Futures platforms. Binance and Kraken, two top exchanges saw massive trading movement over the past weekend. Although Binance’s market maker activity was attributed to an “accident,” as per CZ’s tweets, Kraken’s massive whale-like activity, expanding the XBT wick from $12,000 to $8,000 drew more concerned eyes.
Short Term:
Source: Trading View
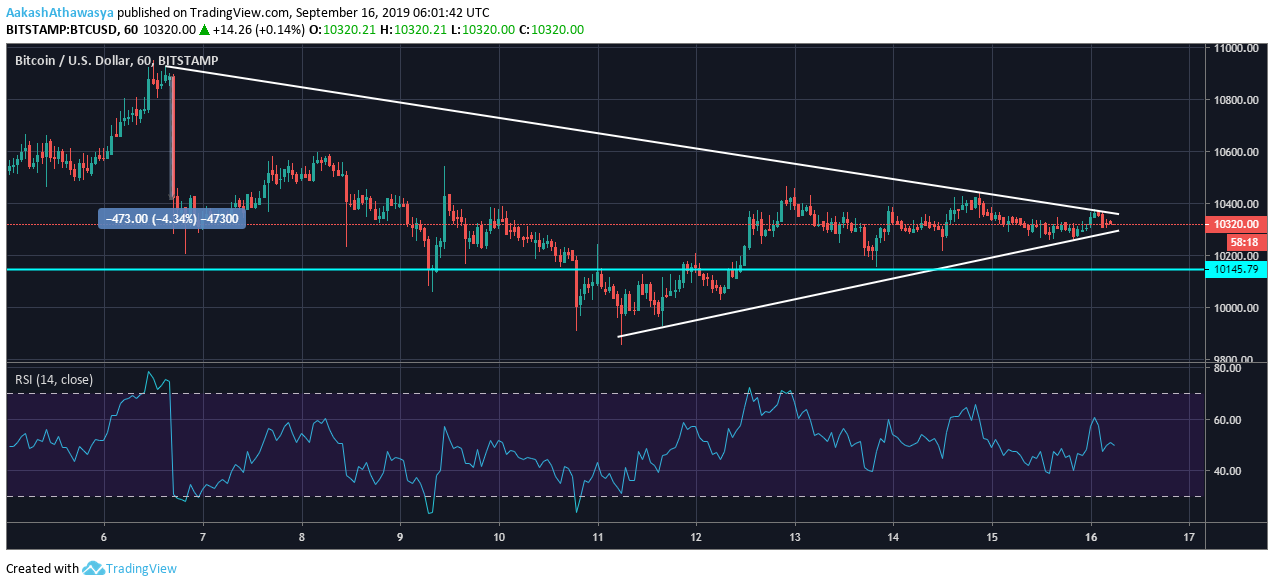
In the short term hourly chart, Bitcoin is looking to be squeezed in a pennant like formation. The evidence for the same is the flagpole presented on 6 September, which marked a massive 4.34 percent drop in Bitcoin’s price. The drop planted the price below $10,500, from which the king coin has not managed to break out of, over the past 10 days. Another evidence of the same can be higher highs seen from 11 September, with the price peaking at $10,334, $10,400, to $10,425, lower lows were also witnessed at $10,046, $10,215, and $10,280.
To add on to the same, a resistance line that looks to be forming a base to a descending triangle is planted at $10,145 which Bitcoin dipped below on 10 September but soon rose above less than 48 hours later.
With the pennant-like formation closing in on the price in the next few days, other factors need to be looked at to ascertain whether this breakout would be bullish or bearish, although it does point to the former. Volume, is on the lower end, while the Relative Strength Indicator [RSI] is fairly healthy on the 50.46 range; however, investor interest has been slipping since the 13th, when it last peaked over the ‘overbought,’ 70 zone.
Zooming Out:
Source: Trading View
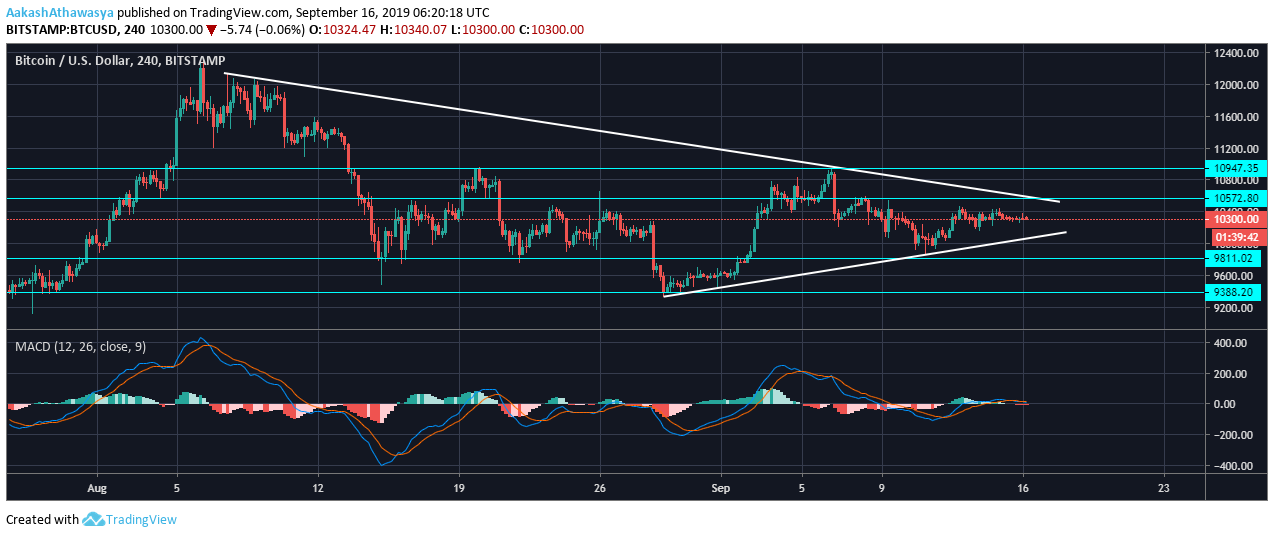
Looking at the 4-hour chart of Bitcoin, the pattern presented above is repeated. Beginning in early August, with the downward sloping upper part of the pennant like formation, and finding a base only in early September, the second chart also pointed toward a squeeze for Bitcoin. The price, after teetering from over $12,000 over a month ago has been moving down consistently till the early days of the current month, which showed signs of the beginning of a meager recovery.
A drooping flagpole for this formation was seen with the falling price from 12 August – 15 August. The squeeze, once again, indicated a bullish breakout based on the chart above and the way the price is moving, at press time. However, for the same to manifest, the lines need to move closer to each other, and the same will not be materialized for the next couple of days. If a movement upward does happen, the resistance levels that will stand in the way of a BTC breakout is at $10,550 and $10,950, followed by the psychological level of $11,000.
MACD showed neutral movement, at press time, with the MACD line and the Signal line flirting with each other above 0.
All set and done, the current price movement will likely hold for a while prior to a breakout movement, if Bitcoin managed to escape the pennant with healthy technical indicators by its side.