
Bitcoin’s hike over the past week comes to a halt after a 10.63 percent decline was observed the last 24-hours. Bitcoin continued to exhibit weekly gains of 10.85 percent and its market cap remained under $110 billion.
Bitcoin continued to register a trading volume of over $50 billion at press time, and it was valued just under $6000 at press time.
Bitcoin 1-hour chart
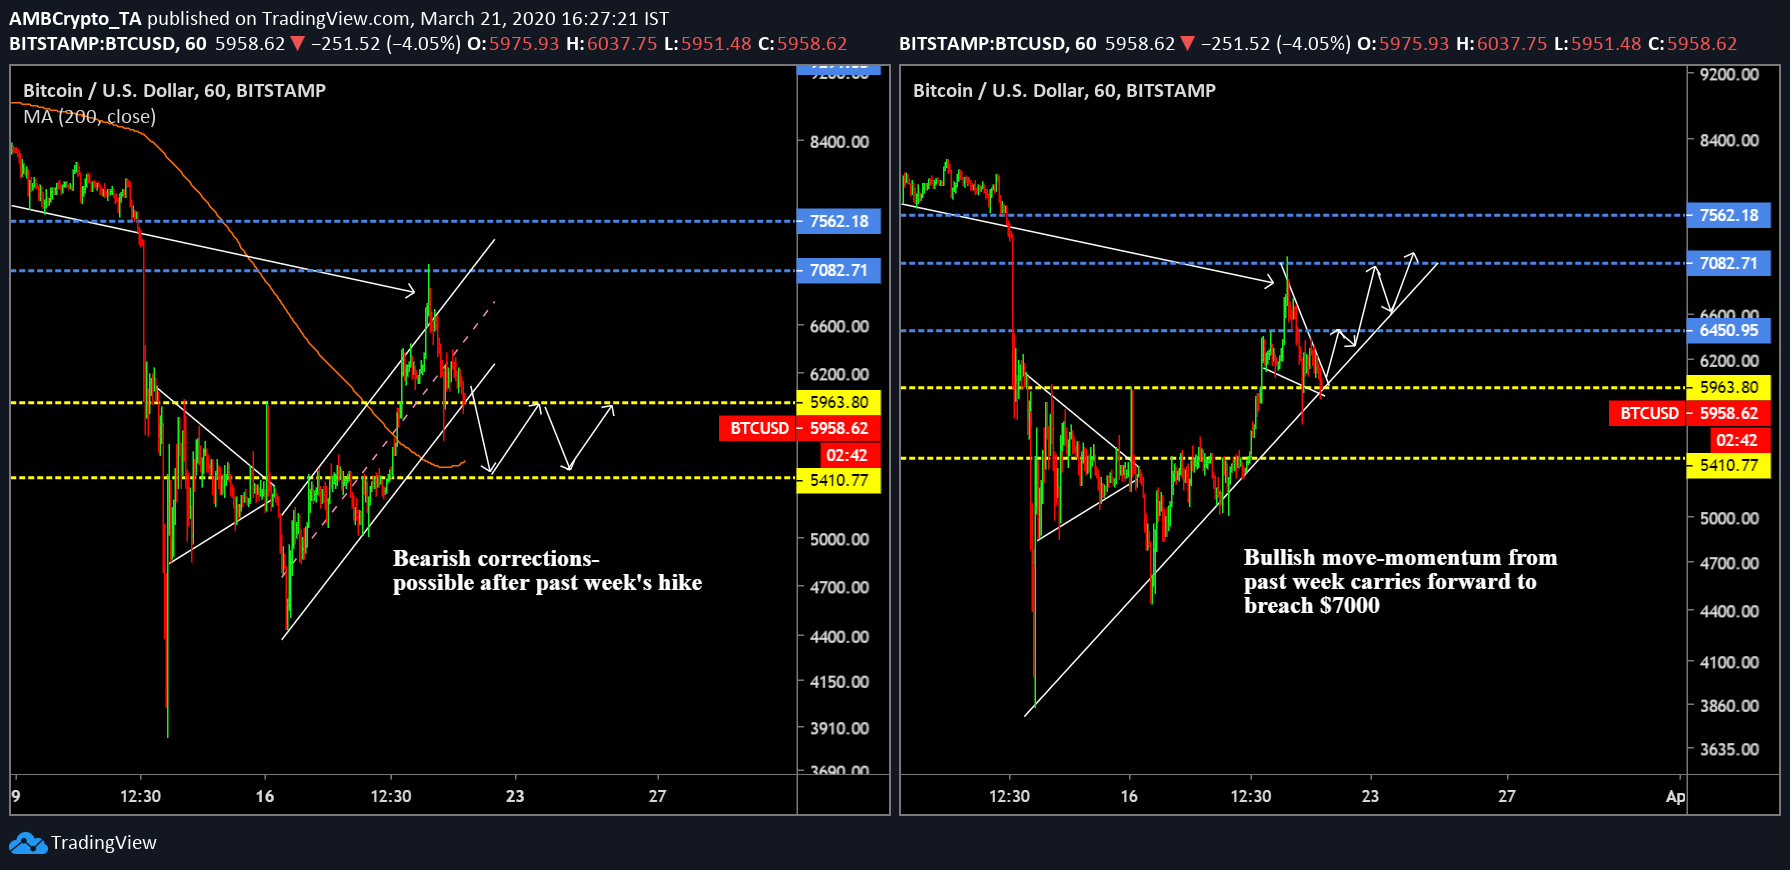
BTC/USD on Trading View
Bitcoin spiked over 25 percent from 19th to 20th March and dipped again by over 10 percent in the past day. Over the past 48-72 days, the asset has already breached above and went below key resistances, implying a high volatility period.
Bitcoin left-side chart
After registering a year to date low of $3800 on 13th March, Bitcoin‘s price managed to scale above $4800 on the same day, and a symmetrical triangle started taking shape until 16th March. For a brief hour, the break out was positive, but the gains were quickly nullified in the following 60 minutes.
Bitcoin’s price slumped down to $4400 again, and since then it has periodically risen in terms of value.
The left side of the chart suggested that Bitcoin has mediated within an ascending channel over the past week. Higher highs were observed at $5337 and $6302, where higher lows were exhibited at $4400, $5039 and $5940.
A pattern that usually foresees a bearish breakout may trigger another pullback down to $5410 and the price may continue to move between $5400 and $6000 until the start of April.
Bitcoin right-side chart
However, considering the bullish momentum persists over the following week, there is a possibility of Bitcoin scaling above $7000 by the end of March. Bitcoin’s price at the moment exhibited a falling wedge pattern, yet to undergo a breakout. A bullish break may allow the asset to breach immediate resistance at $6400 over the next 24-hours.
The asset is likely to re-trace back from $7000 once more, before eventually breaching above the range by month-end.
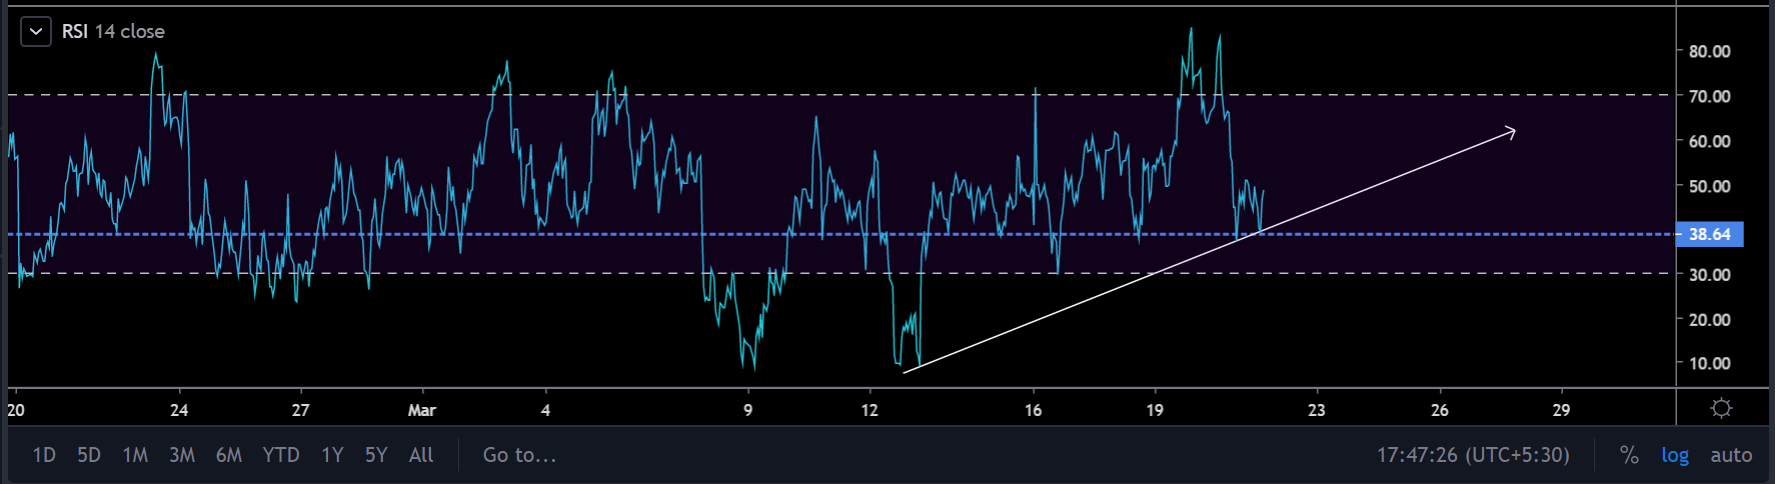
Source: Trading View
With RSI bouncing back from the lower levels of 38 in the charts, the argument towards a bullish narrative substantially increases, as the market continues to project higher levels of activity.
Conclusion
Calling Bitcoin’s exact movement is difficult, considering the high volatility levels. That said, Bitcoin exhibited a certain sense of optimism.