Analysis
Bitcoin Diamond, Qtum, and Stellar price: High-volatility underway?
Almost all cryptocurrencies followed the same pattern as the top coin during this market crash. Altcoins like Bitcoin Diamond, Stellar, and Qtum were no different.
Stellar[XLM]


Source: XLM/USD, TradingView
Stellar’s price has been suffering a major downtrend since Feb 14, as seen in the above chart. The XLM/BTC pair is also seeing a downward run to 0.00000641 BTC. The Chaikin Money Flow [CMF] indicator confirms the downtrend as the indicator is below the zero line at -0.17.
Resistance: $0.050, $0.05, $0.06, $0.07 and $0.08
Support: $0.035, $0.03
Price: $0.039524
Market Cap: $801,733,699
24-hour Volume Trade: $309,169,320
Bitcoin Diamond[BCD]

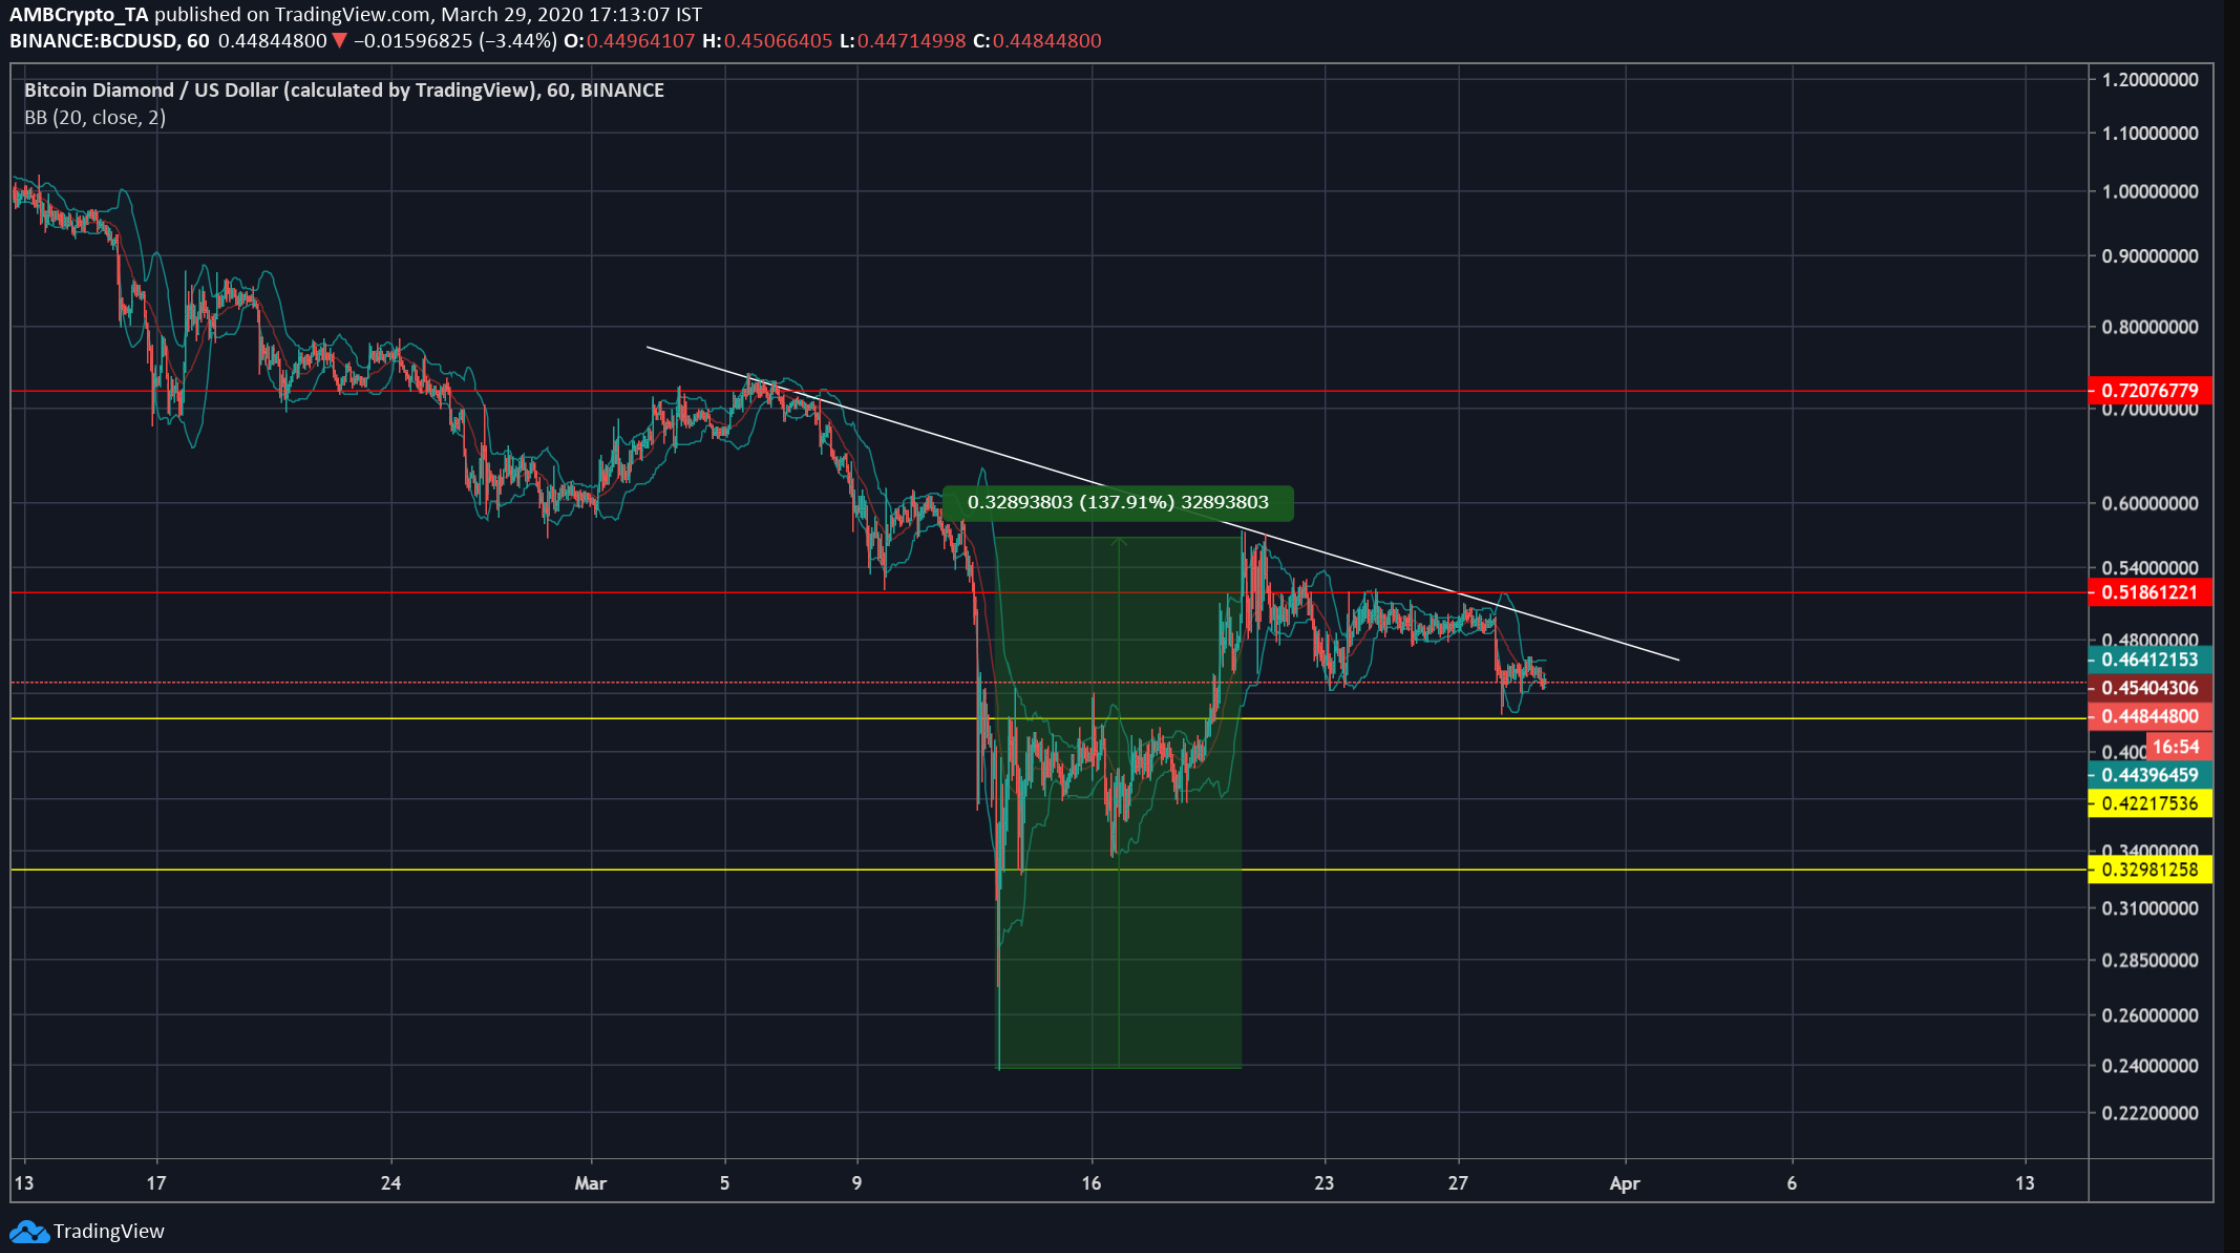
Source: BCD/USD, TradingView
Bitcoin diamond went down to a low of $0.24 on March 13, but quickly recovered and rose by 137.91% percent reaching $0.56 on March 20. The Bollinger Bands, as seen in the chart, were contracting, indicating a decrease in volatility.
Resistance: $0.51 and $0.72
Support: $0.42 and $0.32
At press time:
Price: $0.449059
Market Cap: $83,746,326
24- hour Trading Volume: $6,071,134
Qtum

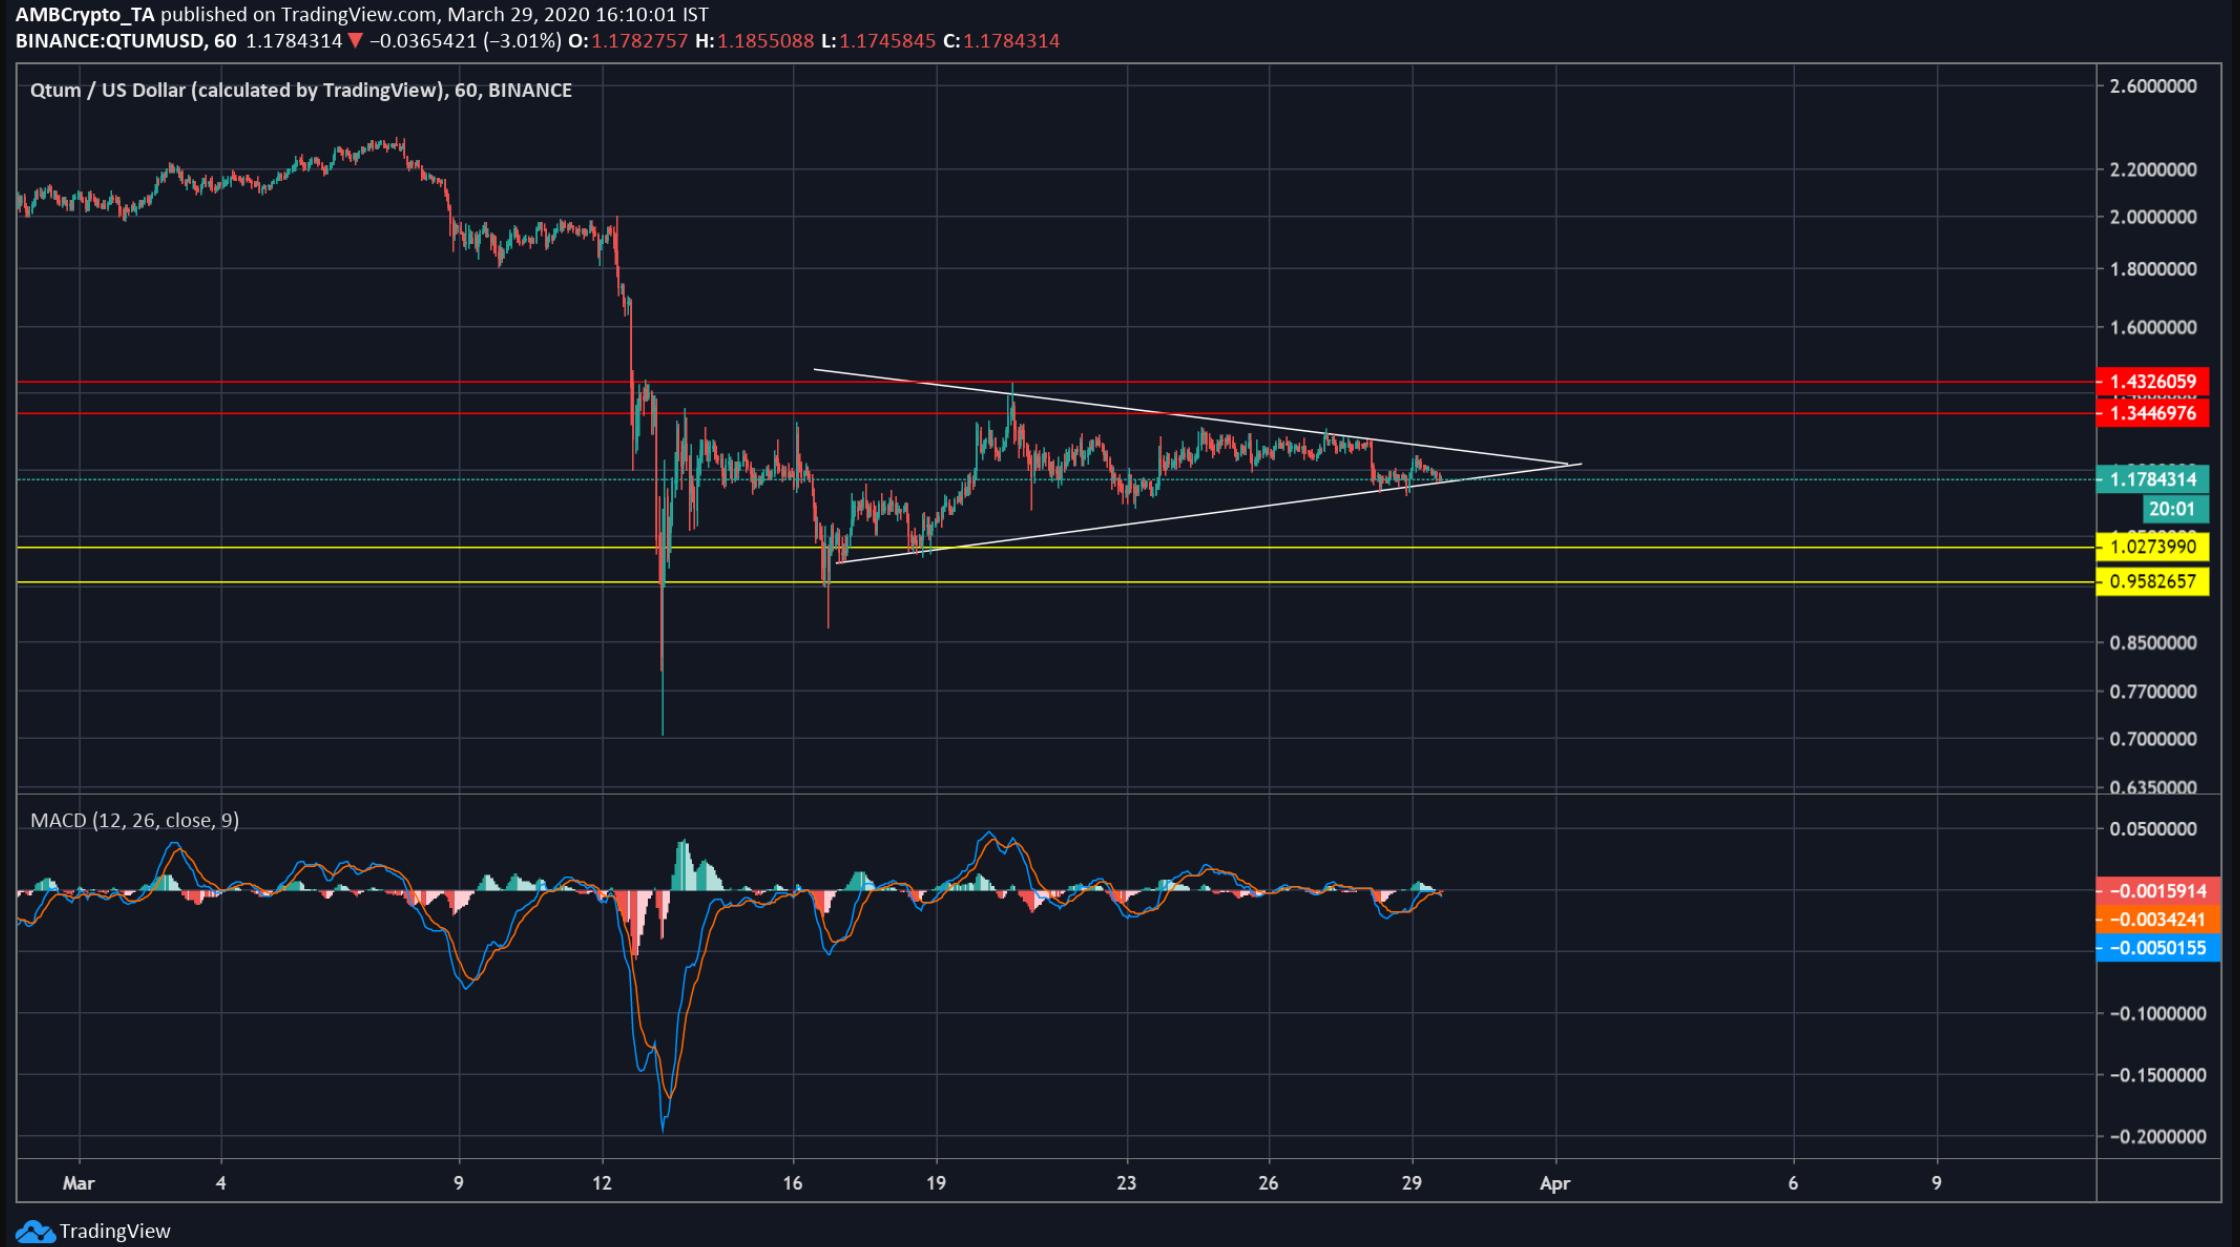
Source: Qtum/USD, TradingView
As seen in the above chart, the price of Qtum formed a symmetric triangle pattern. Additionally, MACD indicator also revealed a very negligible bullish crossover.
Resistance: If there’s an upward breakout, the price faces resistance at $1.3 and further at $1.43.
Support: If there’s a downward breakout, the price might find support at $1.02 and further down at $0.95.
At press time:
Price: $1.17
Market Cap: $114,715,215
24-hour Trading Volume: $351,550,785