Analysis
Bitcoin Cash short-term price analysis: 26 August

The 24-hour chart marked one of the strongest correction periods for the collective cryptocurrency space in August. Bitcoin re-tested its support range from $11,400-$11,200 at press time. Taking the king coin’s cue, its forked cousin Bitcoin Cash followed behind and depleted towards a critical range as well. At press time, Bitcoin Cash was valued at $274 with a market cap of $5.06 billion.
Bitcoin Cash 1-hour chart

BCH/USD on Trading View
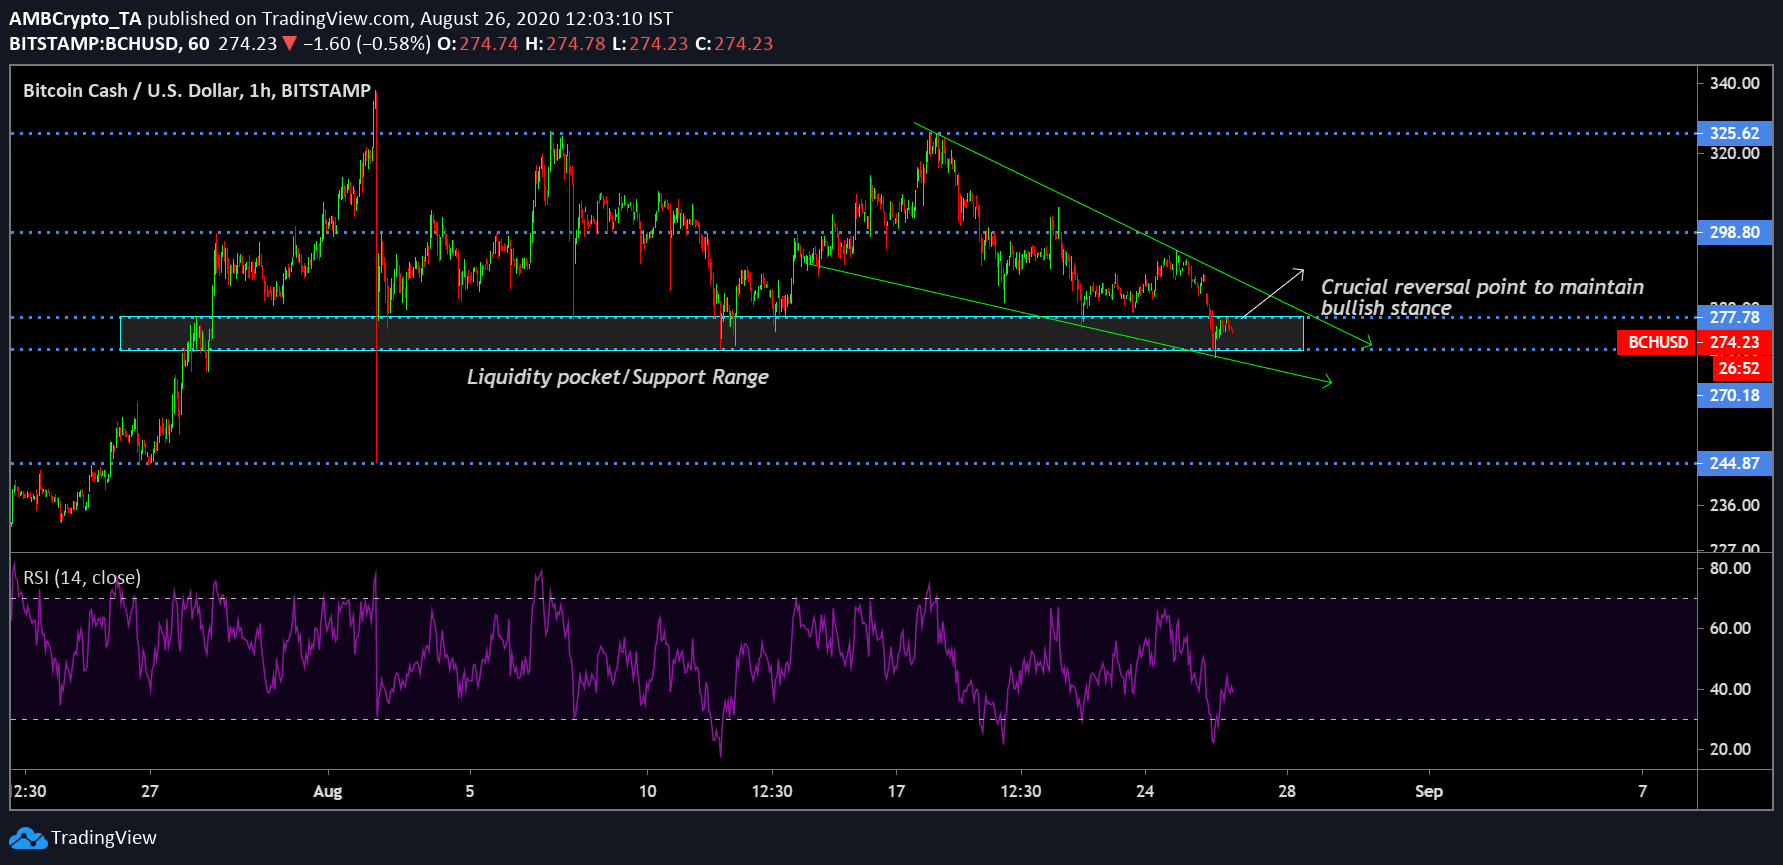
According to the 1-hour chart, Bitcoin Cash was oscillating between trendlines of a falling wedge which usually carries bullish implications. However, in spite of possibly attaining another spike, Bitcoin Cash is currently placed at a crucial support range. Since the start of the bullish rally on 27 July, BCH managed to recover from the range between $277 and $270 and consolidate above.
After its recent decline, the asset managed to avoid dropping below $270, which is a positive sign. In order for Bitcoin Cash to maintain mediation in the bullish realm, a recovery above $277 is necessary.
Relative Strength Index remained heavy on the sell-side hence it is imperative that buying pressure improves over the next 24-hours.
Bitcoin Cash 30-min chart
BCH/USD on Trading View
If Bitcoin Cash should breach above $277 in the next 24-48 hours, it opens an opportunity for a long position in the market. Keeping current valuation in mind, an entry position can be facilitated at $272 while keeping stop-loss mark at immediate support $270. Take-profit margin should be ideal at $288, clocking in a Risk/Reward ratio of 4.06x.
However, it is important to keep in mind that BCH is not exactly out of the bearish grasp, as Awesome Oscillator suggested bearish momentum was still active in the charts.
Conclusion
Bitcoin Cash should attain a position above $277 within the next 24-48 hours.
Disclaimer: The following price prediction should not be taken as investment advice. The prediction should materialize within the next 24-48 hours.

