Bitcoin Cash
Bitcoin Cash short-term Price Analysis: 22 July

Disclaimer: The following article attempts to analyze the evolving trends in the Bitcoin Cash market and its impact on the price.
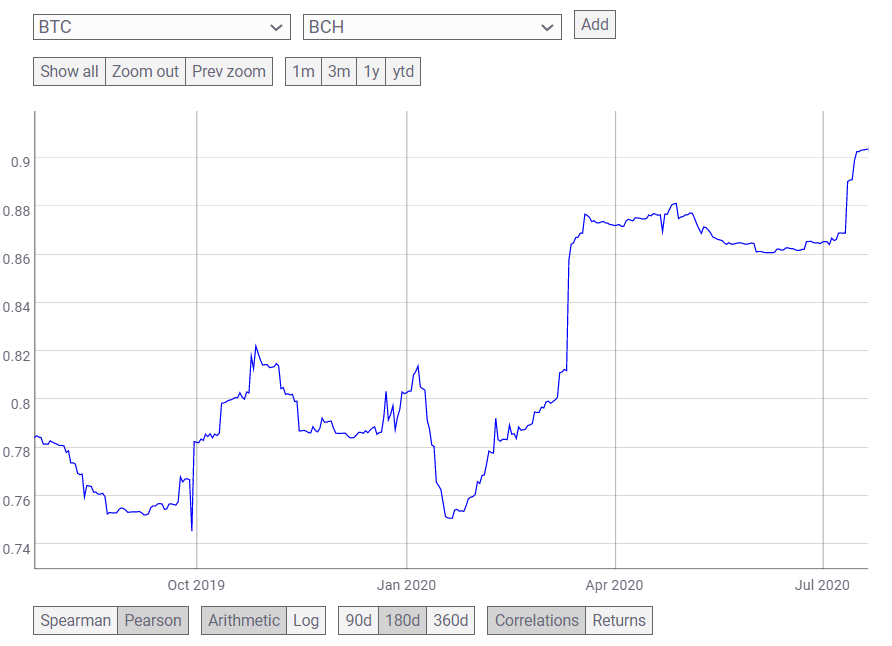
Even though the altcoins have been witnessing independent movement from that of Bitcoin’s price action, the king coin’s hard fork Bitcoin Cash [BCH] has been unsuccessful in doing so. The Correlation between BTC and BCH has been once again rising. According to the correlation chart provided by CoinMetrics, the correlation between the two assets was plateauing since June and was reported at 0.8688 on 10 July, however, within 10 days, this value shot up to 0.9035 marking an all-time high.

Source: CoinMetrics
As the correlation strengthens, the surge in Bitcoin’s market yesterday was also mirrored by Bitcoin Cash [BCH] pushing its price above its consolidation zone to a peak of 232.85. However, as the price retracted within hours, BCH was being traded at $230.01.
Source: BCH/USD on TradingView
According to the hourly chart of the digital asset, its price was predominantly stuck between $220 and $226 from 16 July to 21 July. However, the boost in the market on 22 July, pushed the coin’s price higher as it briefly breached above the $232 resistance and fell. The falling price formed a part of a descending channel, that connected BCH’s lower highs and lower lows between a parallel channel.
As the Bollinger bands indicator appeared to converge after Tuesday’s volatility, the signal line was moving below the price bars. This indicated a bullish trend evolving in the market. The Chaikin Money Flow was confirming the trend as it pointed at the high buying pressure in the market, currently.
Source: BCH/USD on TradingView
As the price of BCH may hit an upwards trend, its important support points remain at $229, which it was currently at. While the next resistance remained at $232.90, which was a price point that BCH saw last earlier in July. However, if the price of the coin slips under $229.34, it may dip to $226, which was acted as solid support and resistance for BCH and may help the price bounce back.

