Analysis
Bitcoin Cash short-term Price Analysis: 20 June

Disclaimer: The following analysis attempts to foresee Bitcoin Cash’s price movements over the course of the next 24-hours
Bitcoin Cash noted an impressive price rally this year. However, at the time of writing, BCH was still far from recovering more than 50 percent of its February values. In fact, at press time, the cryptocurrency market was registering another pullback, following which the coin’s price dropped to $231.80 on the charts. However, while the drop in its price was significant, a respite could possibly be on the cards in the near-term.
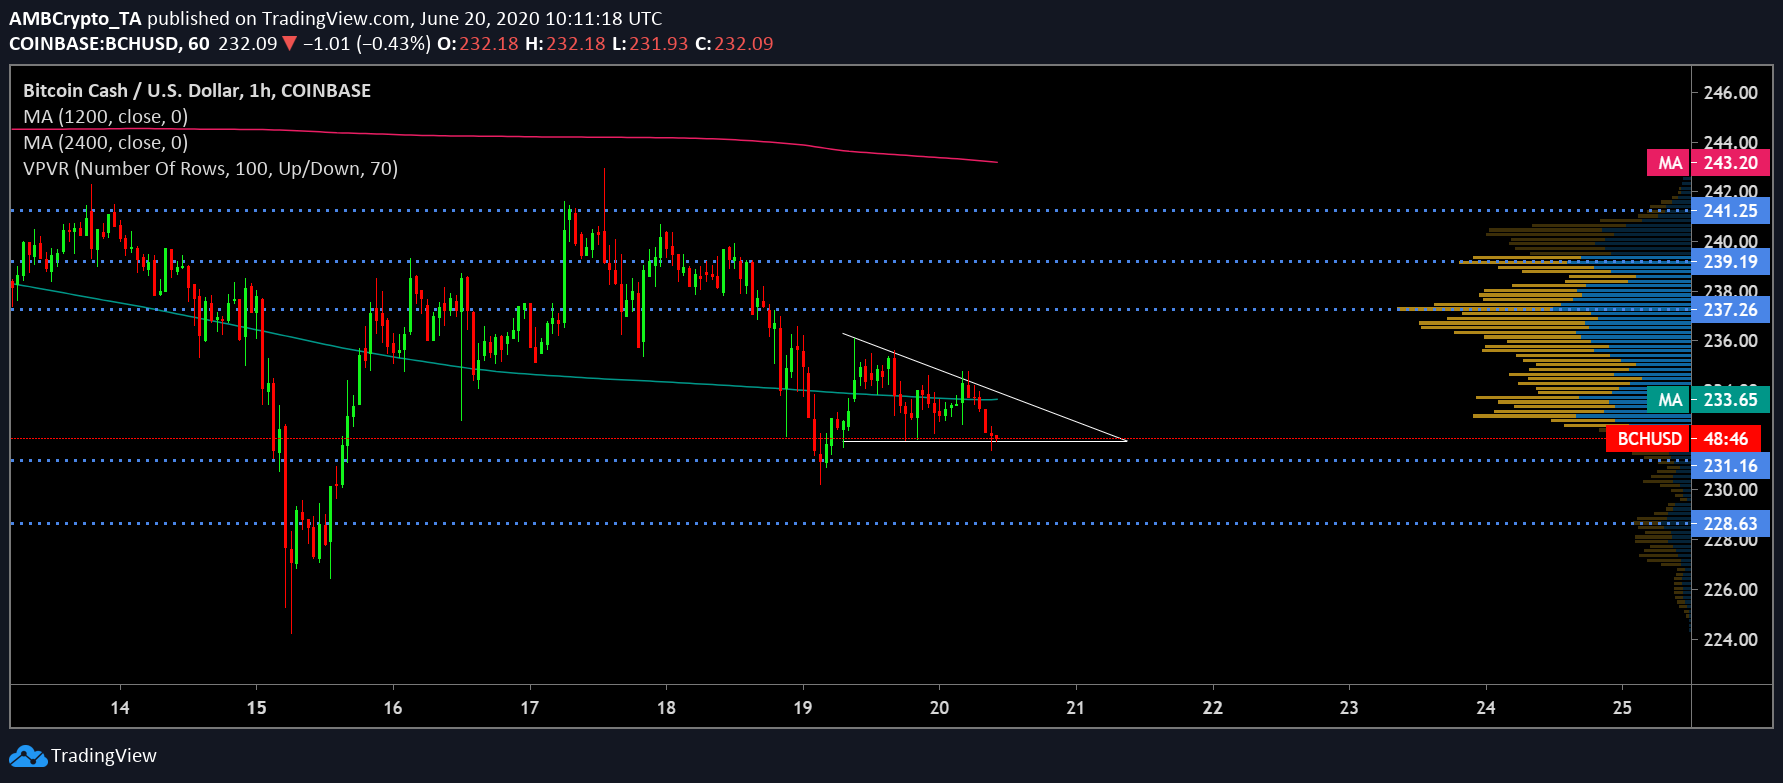
Bitcoin Cash [BCH] Hourly Chart

Source: BCH/USD on TradingView
At the time of writing, Bitcoin Cash’s price candles appeared to be oscillating between the trendlines of the descending triangle pattern, the completion of which was expected for 21 June. A breakout to the upside following the breakout can be predicted.
This assertion is backed by the fact that the daily moving averages were also aligned with the prospect of a bullish break. The 50 DMA [Pink] underwent a bullish crossover with the 100 DMA [Blue] in the first week of June. This trend has continued, with the 50 DMA continuing to hover well above the latter on the charts after three weeks.
Source: BCH/USD on TradingView
The MACD indicator, however, aligned with the bears as it slid below the signal line following the significant correction in Bitcoin Cash’s price action.
As noted by the descending triangle pattern formation, the BCH price candles would undergo a brief dip supported by the horizontal trendline before bouncing back above before completion of the pattern and a subsequent breakout. Hence, the MACD indicator just underwent a bearish crossover.
A consolidation phase in the current market for Bitcoin Cash was also underlined by the VPVR indicator which pointed to substantial trading activity. As supported by the daily moving average and the pattern formation, BCH could potentially witness a bullish breakout on the 21st of June.
If this materializes, the fork coin would first breach the 100 DMA which has been resisting an upward price movement, then eventually climb all the way to $237, as implied by the VPVR indicator. If the bullish trend gains necessary momentum, BCH could surge further to levels $239 and $241 in the in short-term.
The horizontal trendline supported Bitcoin Cash’s price candles from falling any further, with other support targets for the coin observed to be at $231.1 and $228, respectively.

