Bitcoin Cash
Bitcoin Cash short-term Price Analysis: 12 August

After Bitcoin’s collapse down to $11,285, the rest of the altcoin market finally appeared to tag along for the current bearish ride. Bitcoin Cash, just like other major altcoins slipped by 12.36%, as its valuation witnessed a downtrend from a high of $305 to $270.
After the markets actively pictured a recovery, a short-term long opportunity is prevailing for Bitcoin Cash in the industry.
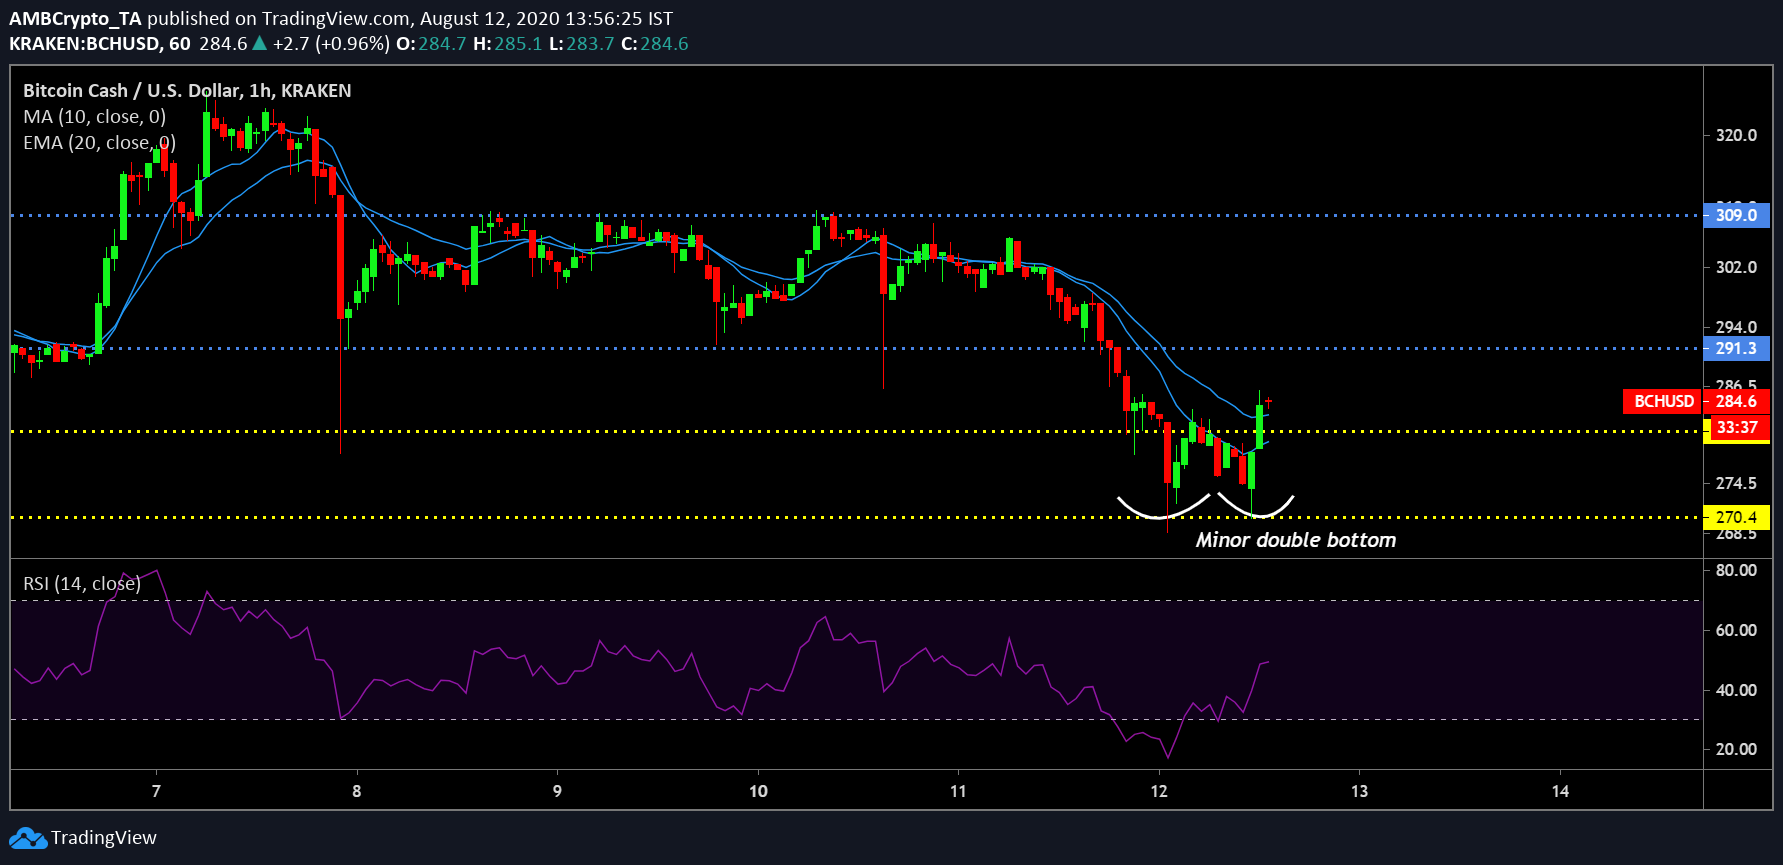
Bitcoin Cash 1-hour chart

Source: BCH/USD on Trading View
Analyzing the short-term chart for Bitcoin Cash, clear decimation of the immediate support at $291 can be observed. The price dipped under $280 as well but at press time, recovery is taking place overturning the former bearish trend. The low was registered on $270 a couple of times, which led to a minor double bottom pattern over a period of 8-hours. With the Relative Strength Index or RSI eyeing 50 at the time of writing, a complete recovery of valuation is unlikely.
However, 10-Moving Average (10-MA) and 20-Exponential Moving Average (20-MA) were acting as immediate support for the surge at press time.
Bitcoin Cash 30-mins chart
Source: BCH/USD on Trading View
Now, analyzing the 30-min chart for BCH, a price entry point at $276 with profit margins exit at 291 leads to a risk-reward ratio of 2.39x. The stop loss can be placed at $270, and any declination below that might lead to staggering losses. The minor concern with the 30-min chart is that RSI is already reaching a little saturation in terms of buying pressure hence, a drop down to $280 should be expected.
However, support for 10-MA and 20-EMA should allow the asset to reach $291 before undergoing a trend reversal.
Conclusion
Bitcoin Cash should register a re-test at $291 under the next 12-24 hours.

