Bitcoin Cash
Bitcoin Cash short-term Price Analysis; 10 June

Bitcoin Cash appeared to have been trapped below the $260-region for the past couple of weeks. Several pullbacks prevented any significant upside break. BCH may have to wait for a bullish revival.
Bitcoin Cash [BCH] 4-Hour Chart:

Source: BCH/USD on TradingView
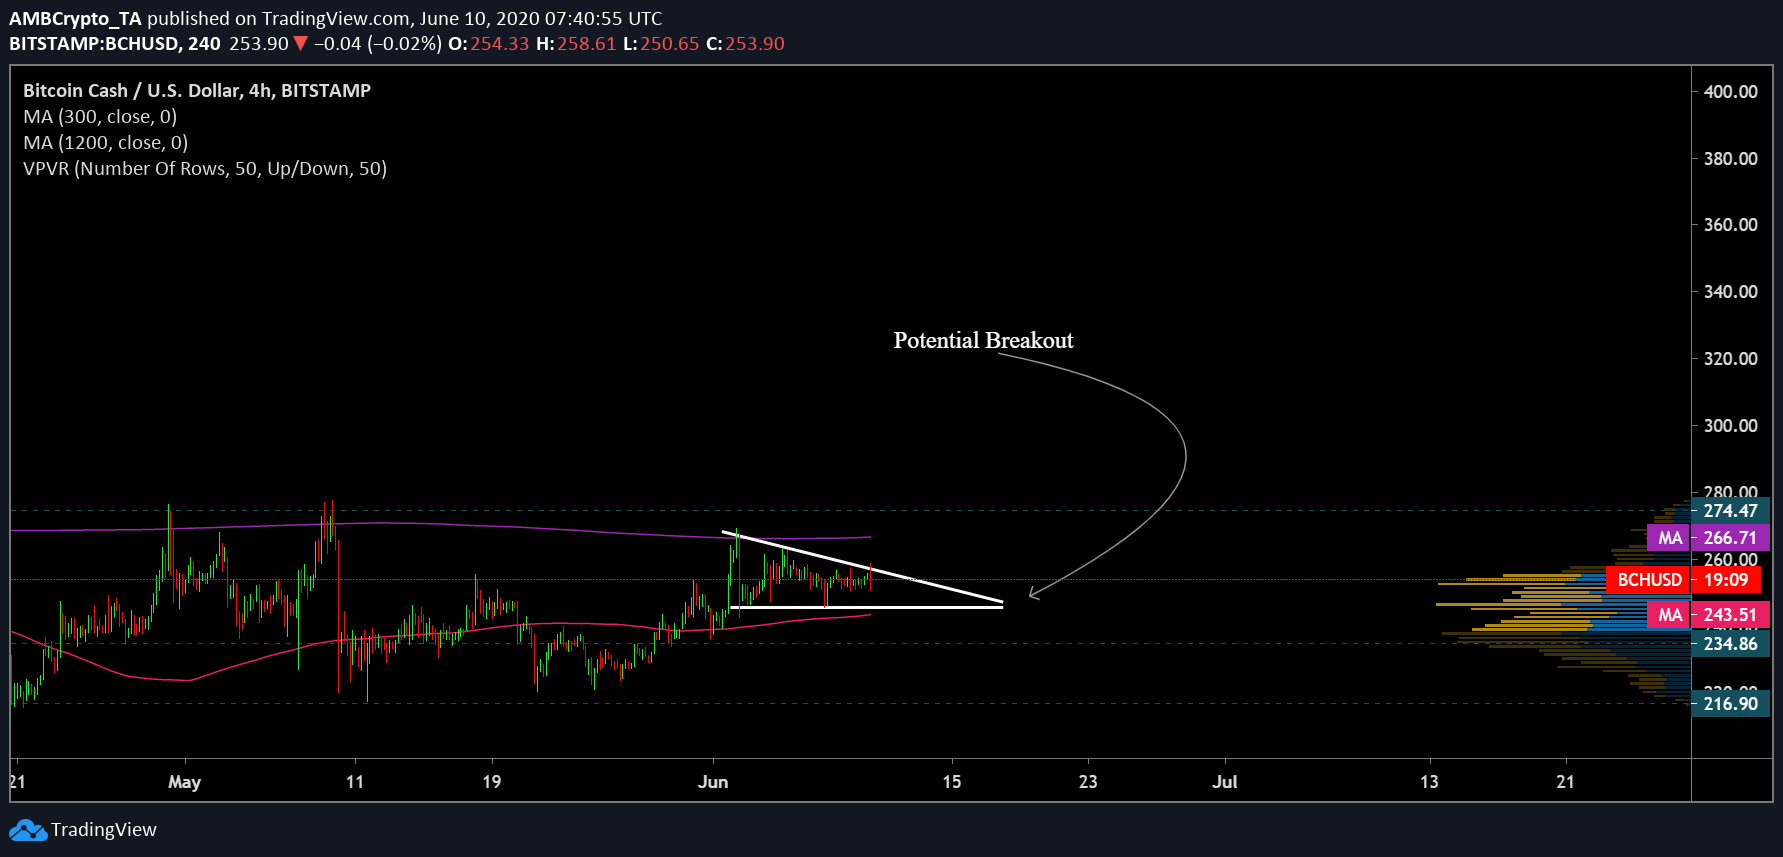
4-hour chart of Bitcoin Cash depicted the formation of a descending triangle pattern with the candles oscillating between a downsloping and a horizontal trendline. Completion of this pattern is expected to occur on 18th of June. This could potentially lead to a bearish breakout. This argument was bolstered by movement of the daily moving averages.
50 DMA [Pink] made an upward lead in the first week of May after sustaining a death cross with the 200 DMA [Purple]. While the upward movement of 50 DMA coincided with the price rise, a golden cross with the 200 DMA does seem to be on the cards. Despite no significant divergence, both DMAs were moving parallel to each other, which was indicative of a delayed bullish phase for the coin.
Source: BCH/USD on TradingView
In addition, RSI also appeared to be struggling to retain its position above 50-median. This was indicative of uncertainty in the crypto market as investors may be contemplating a sell-off sentiment.
A bearish trend was supported by the descending triangle pattern formation, moving averages, while RSI indicator signaled uncertainty gripping the BCH market. In the case of a downward price breakout, the coin could retrace its steps close to the level supported by 50 DMA at $243.5. If the bearish trend persists, the coin could fall to $234.8 as depicted by VPVR indicator, and subsequently to $216. 9-level.
BCH’s price candles were significantly resisted by 200 DMA at $266 point while another level of resistance stood unbreached at $274.47.
Correlation:
Source: Coin Metrics
At the time of writing, correlation coefficient for BCH-BTC was 0.848. Despite a slight decline in correlation, Bitcoin Cash’s has closely followed Bitcoin’s price swings. If Bitcoin manages to surge in the near-term, this would potentially prompt a bullish reversal for the fork coin.
Conclusion:
A bearish breakout could potentially materialize on the 18th of June. In this case, target points for the coin stood at $243.5, $234.8, and $216. 9.

