Analysis
Bitcoin Cash short-term Price Analysis: 09 September

Over the past 6-days, the collective digital assets industry has taken somewhat of a breather as the bears seemed to have reduced their pressure on the market. Yet, most of the altcoins are still steadily dropping. The bottom was created for Bitcoin and the rest, on 3rd September itself, however, after rallying back above immediate resistance, BCH has continued to move right above its support. With a market cap of $4.17 billion, BCH is currently valued at $224.
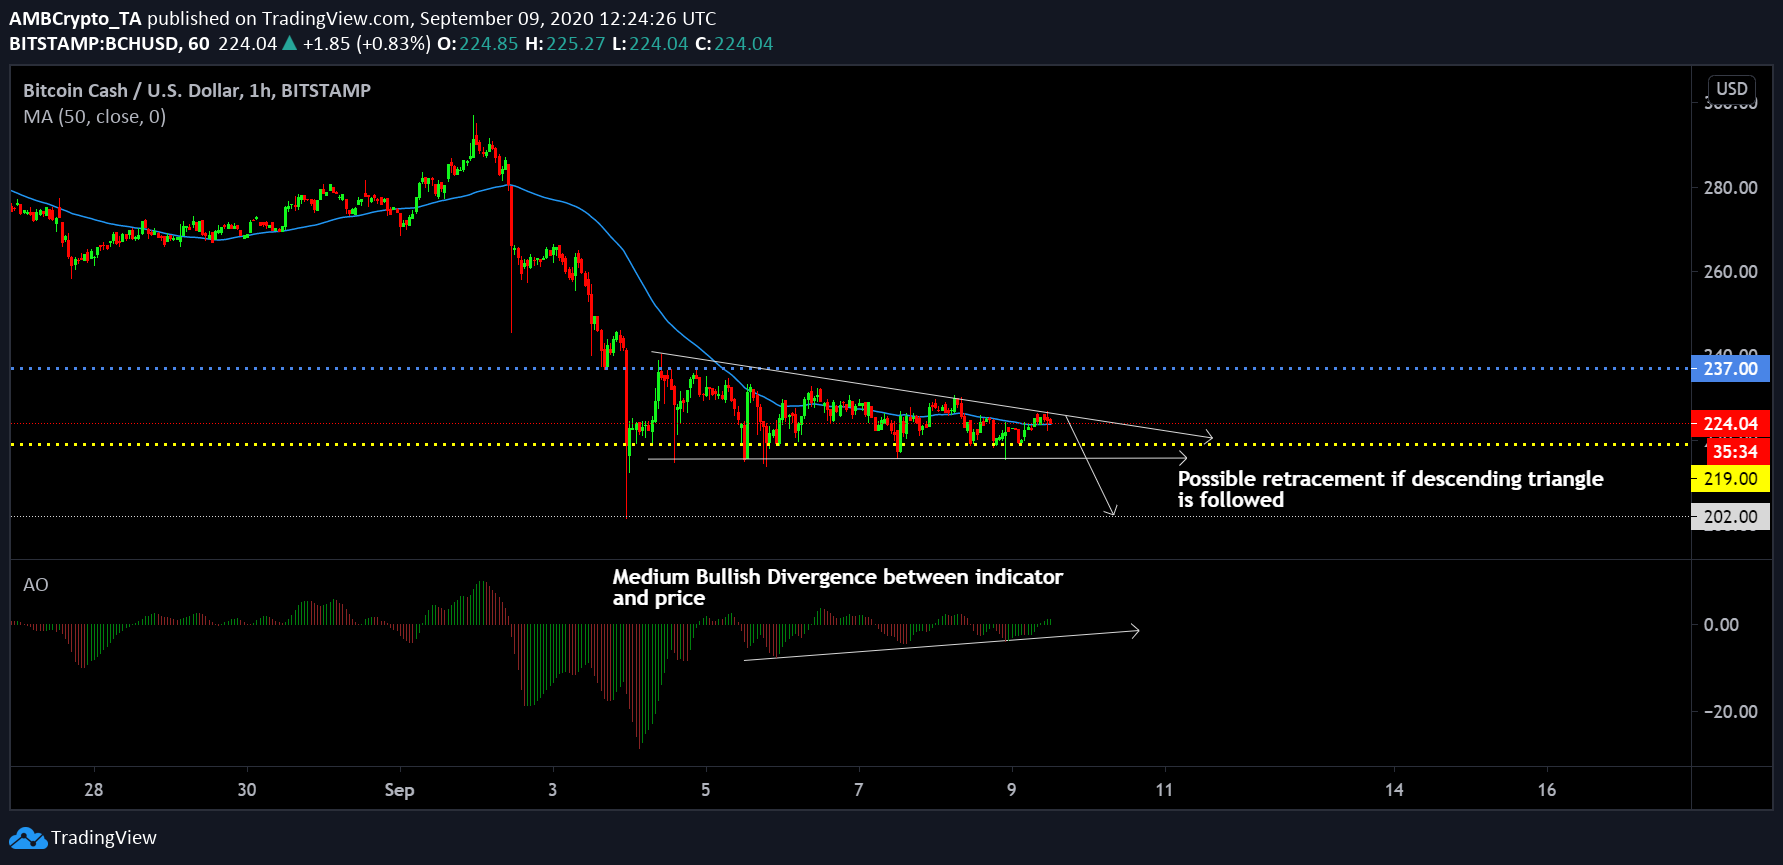
Bitcoin Cash 1-hour chart

Source: BCH/USD on Trading View
As identified in the charts, Bitcoin Cash’s price oscillation over the past week has led to the formation of a descending triangle. Incurring the bullish implications from this pattern, there seems to be another inevitable correction for BCH down the line. The asset displayed strong lower highs with the declining trendline but momentarily maintained a bullish picture with the 50-Moving Average.
With the price re-testing support at $219 for more than 3 times over the last 7-days, there is a chance that BCH may re-test its previous bottom at $202.
Meanwhile, the fact that Awesome Oscillator registered a minor high while the price re-tested from similar support indicated medium bullish divergence for the short-term period. This causes immense uncertainty in terms of movement at press time, as volatility might peak and take the price in any direction.
Bitcoin 30 min-chart
Source: BCH/USD on Trading View
Right now, it is difficult to call a long or short position in the market considering there is a contradiction between two sets of observations. The Relative Strength Index or RSI also remained at a neutral point, which meant that buyers and sellers were both putting up an equal amount of pressure.
Bitcoin Cash’s next move is possibly dependent on the rest of the market for the time being, with clear cut indications absent on its own chart.

