
Bitcoin was trading at $11,416, at press time, and commanded a dominant share of 59% in the market. Its fork coin Bitcoin Cash exhibited a bullish signal as it traded just under an important level at $252. NEM, on the other hand, invalidated a bullish pattern at the behest of steady selling pressure on the charts. Popular privacy coin Zcash was on a strong downtrend, however, it could re-test a level of resistance, before further losses.
Bitcoin Cash [BCH]
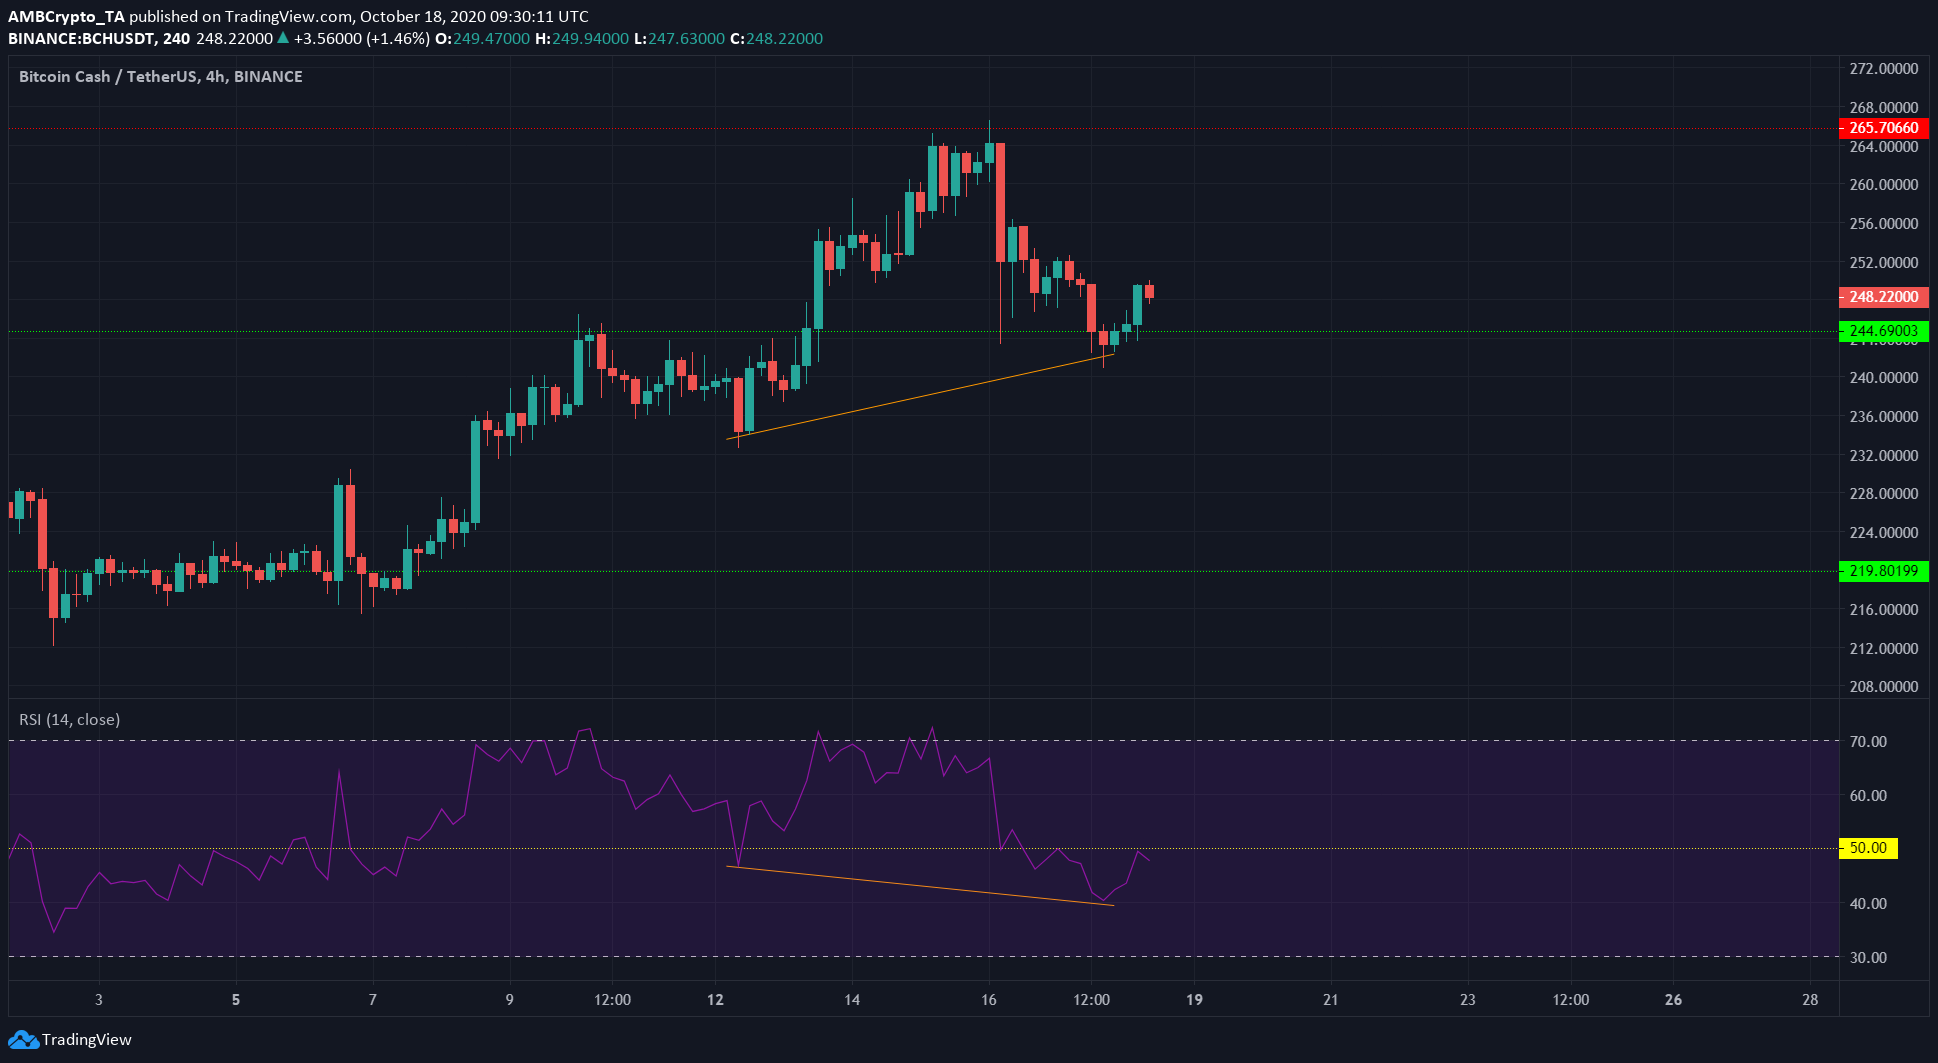
Source: BCH/USDT on TradingView
Bitcoin Cash exhibited a hidden bullish divergence as its price made a higher low, while the momentum indicator (RSI) made a lower low (orange).
Hidden divergences usually hint at the continuation of the previous trend. The trend has been bullish for BCH over the past few weeks, and this could see BCH move toward its resistance at $265.
However, the RSI was still under 50 and a retest of $244 before a move north could take place soon.
NEM [XEM]
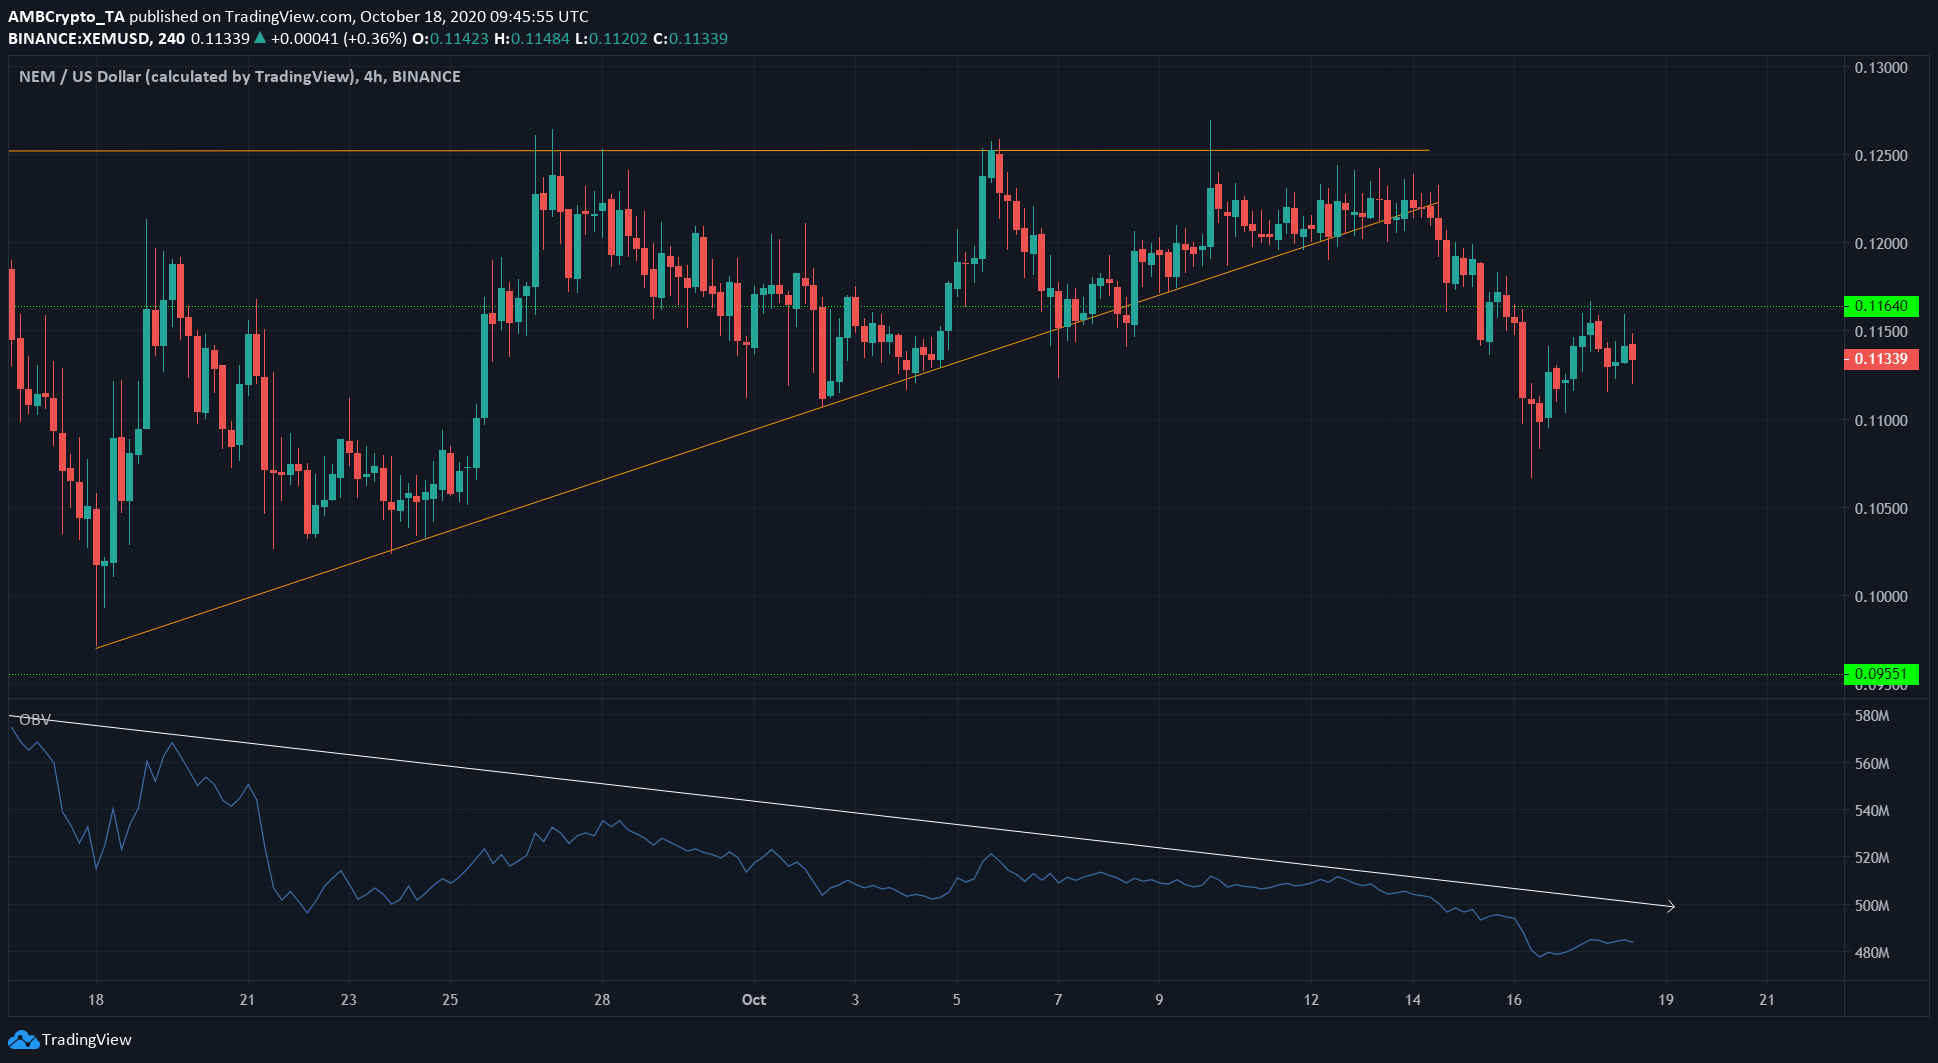
Source: XEM/USD on TradingView
The cryptocurrency’s price formed an ascending triangle (orange), a pattern that generally sees the price break out to the upside.
However, throughout the time XEM traded within the pattern, the OBV was trending lower (white), showing that buying volume was diminishing.
The price closed beneath the rising trendline, a sign that the pattern had failed and was likely to see a break to the downside. XEM lost 10% in a drop to $0.109, before bouncing to test the resistance at $0.116.
Zcash [ZEC]
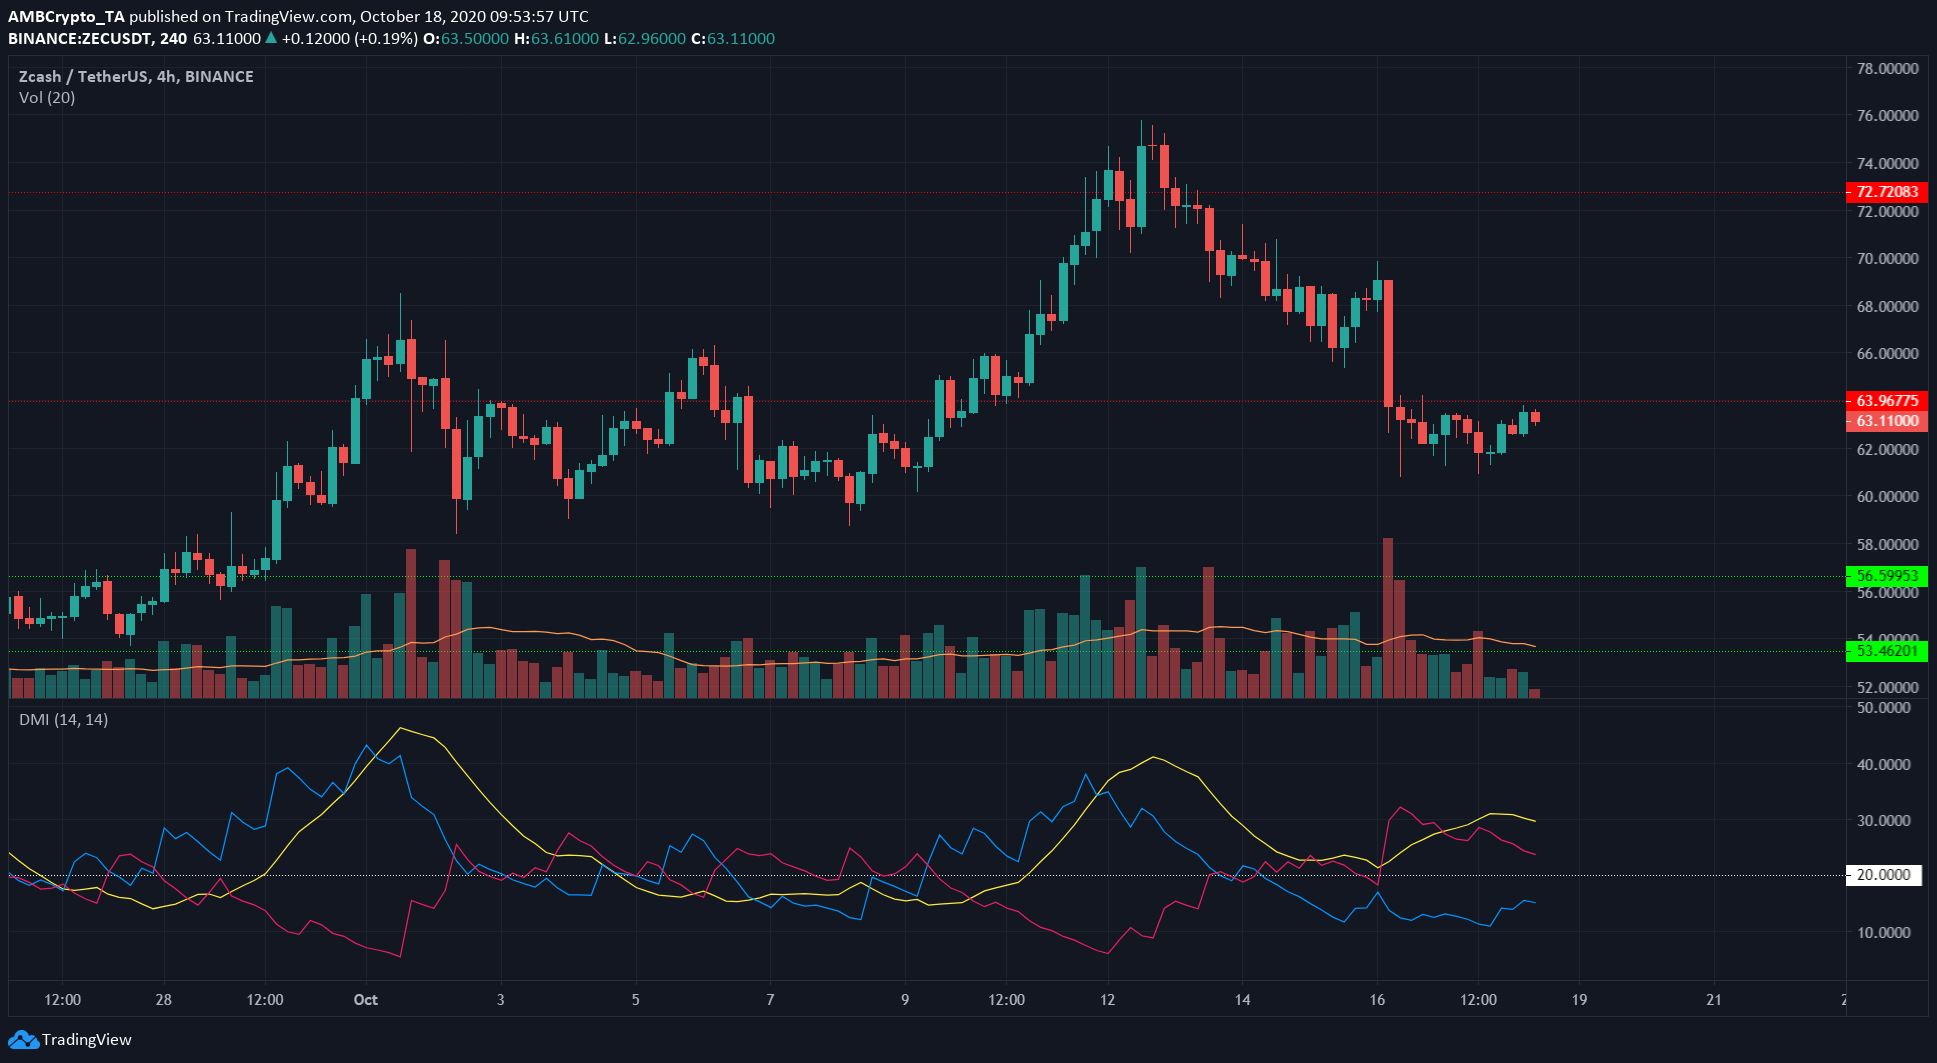
source: ZEC/USDT on TradingView
Zcash briefly breached its resistance at $72.7, before facing a wave of selling pressure. ZEC was dragged under its resistance and dropped beneath the support level at $63 as well.
At the time of writing, ZEC appeared to re-test the resistance. It was possible that the price could reclaim the $66-level, but the past few sessions had trading volumes that were well below average.
This suggested that the rise from near $60 was not a bullish indication. ZEC can be expected to move down towards the next level of support at $56 over the next few days.
The Directional Movement Index (DMI) also pointed to a strong bearish trend, as the ADX (yellow) was above 20 while the -DI (pink) indicated the direction.