- Ethereum’s price moved sideways in the last week, while its Open Interest rose during the same period
- This, according to a CryptoQuant analyst, suggested an impending price volatility
Ethereum [ETH] could see significant price swings in the near future. This is due to the coin’s current sideways price action and rising Open Interest in the Futures market, pseudonymous CryptoQuant analyst Crypto Sunmoon noted in a new report.
Is your portfolio green? Check out the ETH Profit Calculator
Last month’s rally pushed ETH’s value above $1840 for the first time since August. However, growing profit-taking activity has caused the alt’s price to oscillate between $1800 and $1840 in the last week.
During the same period, its Open Interest grew by 7%, according to data from Coinglass.
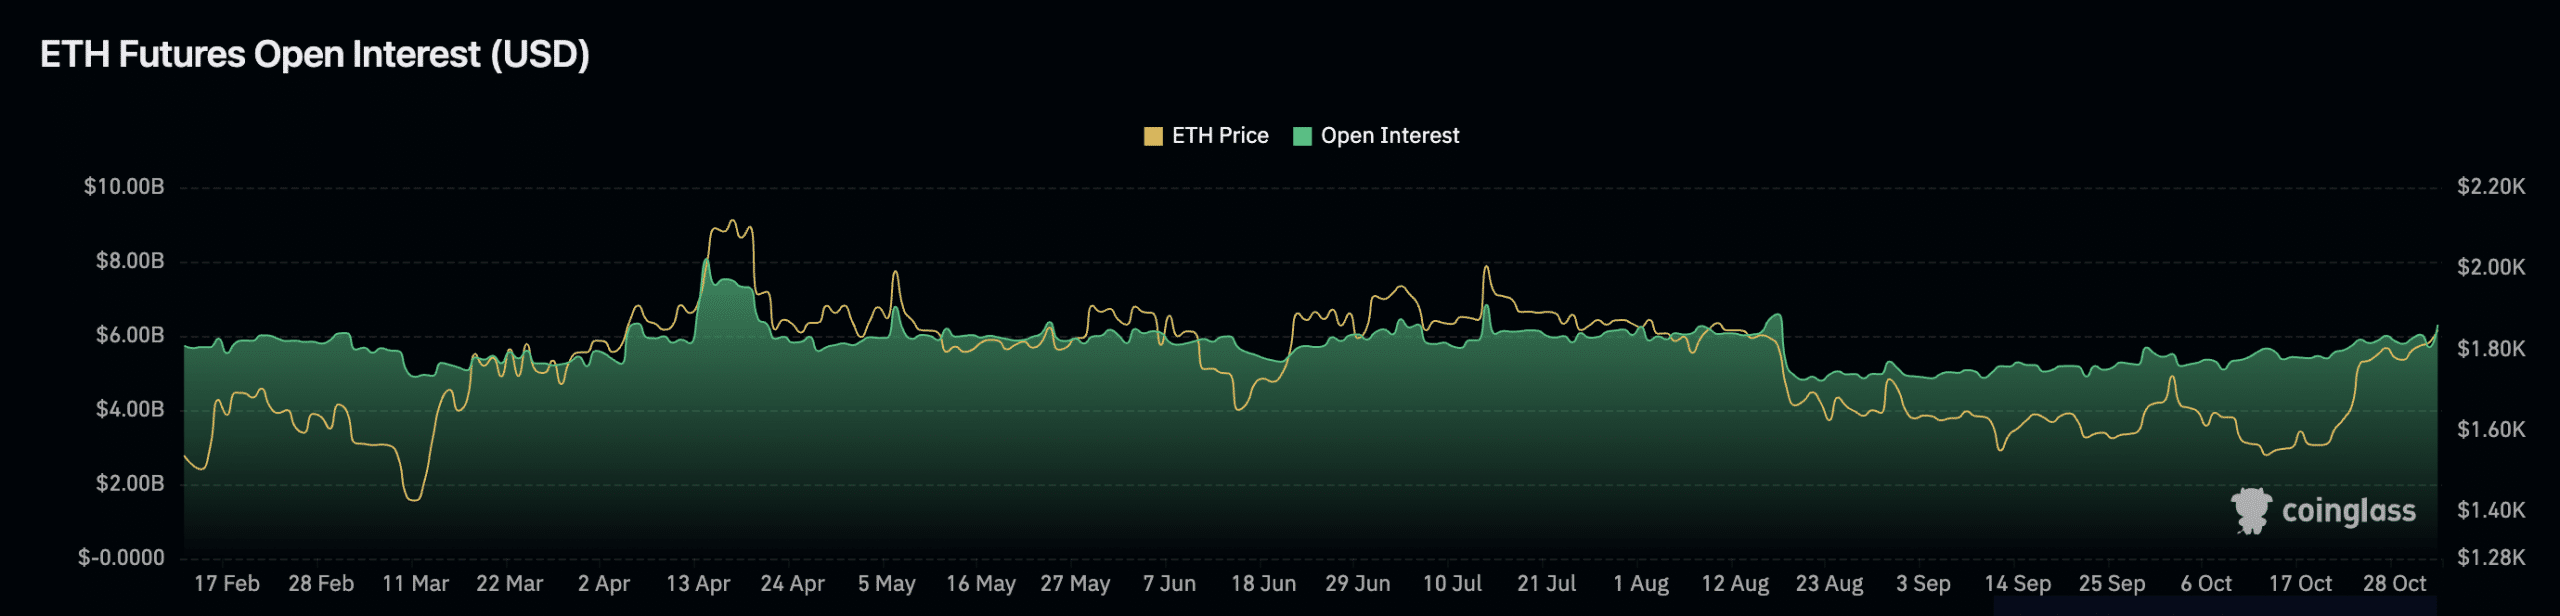
Source: Coinglass
As noted by Sunmoon, the combination of sideways price action and rising Open Interest in the Futures market suggested that ETH may be poised for a volatile move in the near future.
This is because even when an asset consolidates within a tight range in the spot market, the rise, or decline in its Open Interest indicates that Futures market participants are actively positioning themselves for potential price changes.
In ETH’s case, the positive funding rates suggested that traders have continuously opened positions in favor of price growth.
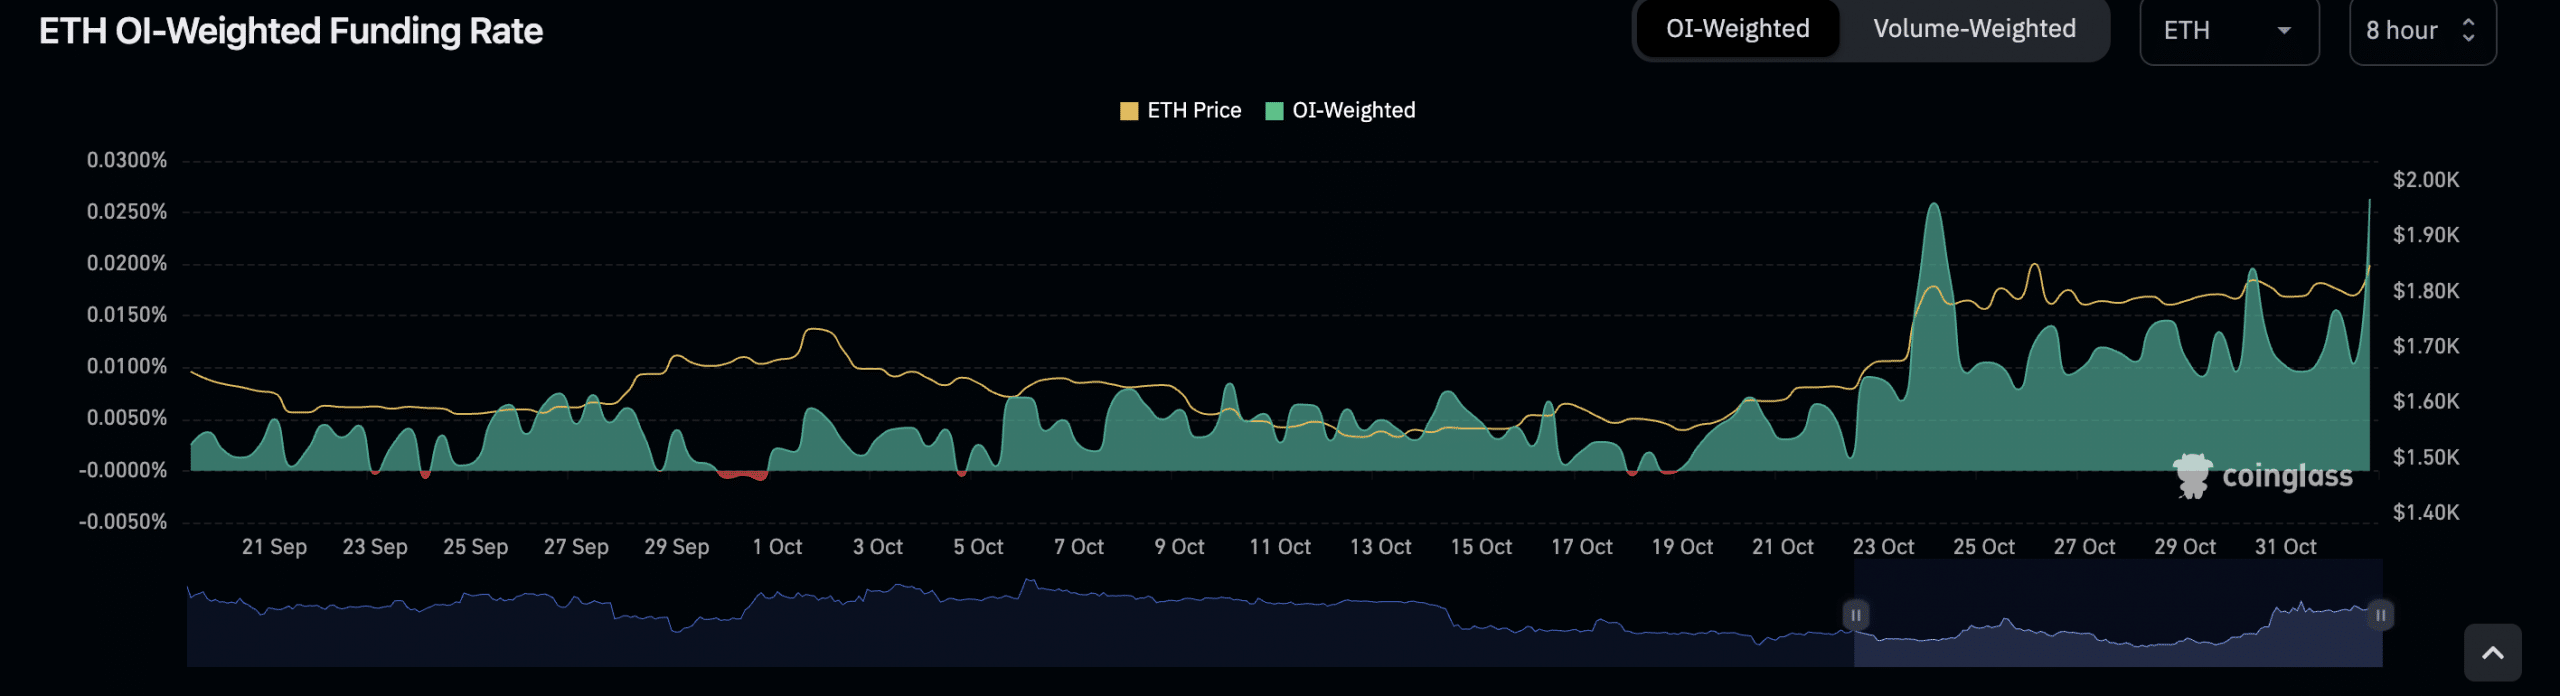
Source: Coinglass
Positive funding rates suggest that there is more demand for long positions than short positions, and the traders opening these long positions are willing to pay short traders to keep their positions open.
At press time, ETH’s funding rates across crypto exchanges stood at 0.026%, data from Coinglass showed.
The extent of volatility might have been overstated
Although readings from ETH’s Bollinger Bands (BB) observed on a daily chart confirmed Sunmoon’s projections of price volatility, its extent might have been exaggerated.
The BB indicator measures the volatility of an asset’s price and identifies potential trading opportunities. At press time, a wide gap existed between the upper and lower bands of ETH’s BB.
When the gap between the two bands is much, it often signals that the market is volatile and that a breakout is likely imminent.
However, ETH’s declining Chaikin Volatility since 27 October indicated that the probability of a potential price swing has continued to reduce.
This indicator measures the difference between an asset’s high and low prices over a specified period. Generally, when the Chaikin Volatility indicator rallies, it signals great price movements and potential volatility.
On the other hand, a decline indicates that the range between the high and low prices is narrowing; therefore, a price swing is less likely.
At 17.69 at press time, the value of this indicator has dropped by over 80% in the last week.
Read Ethereum’s [ETH] Price Prediction 2023-24
Likewise, ETH’s Average True Range (ATR) has suffered a similar decline. At 54.52 at press time, this indicator has dropped by 6% in the last seven days.
The ATR also measures market volatility by calculating the average range between high and low prices over a specified number of periods.
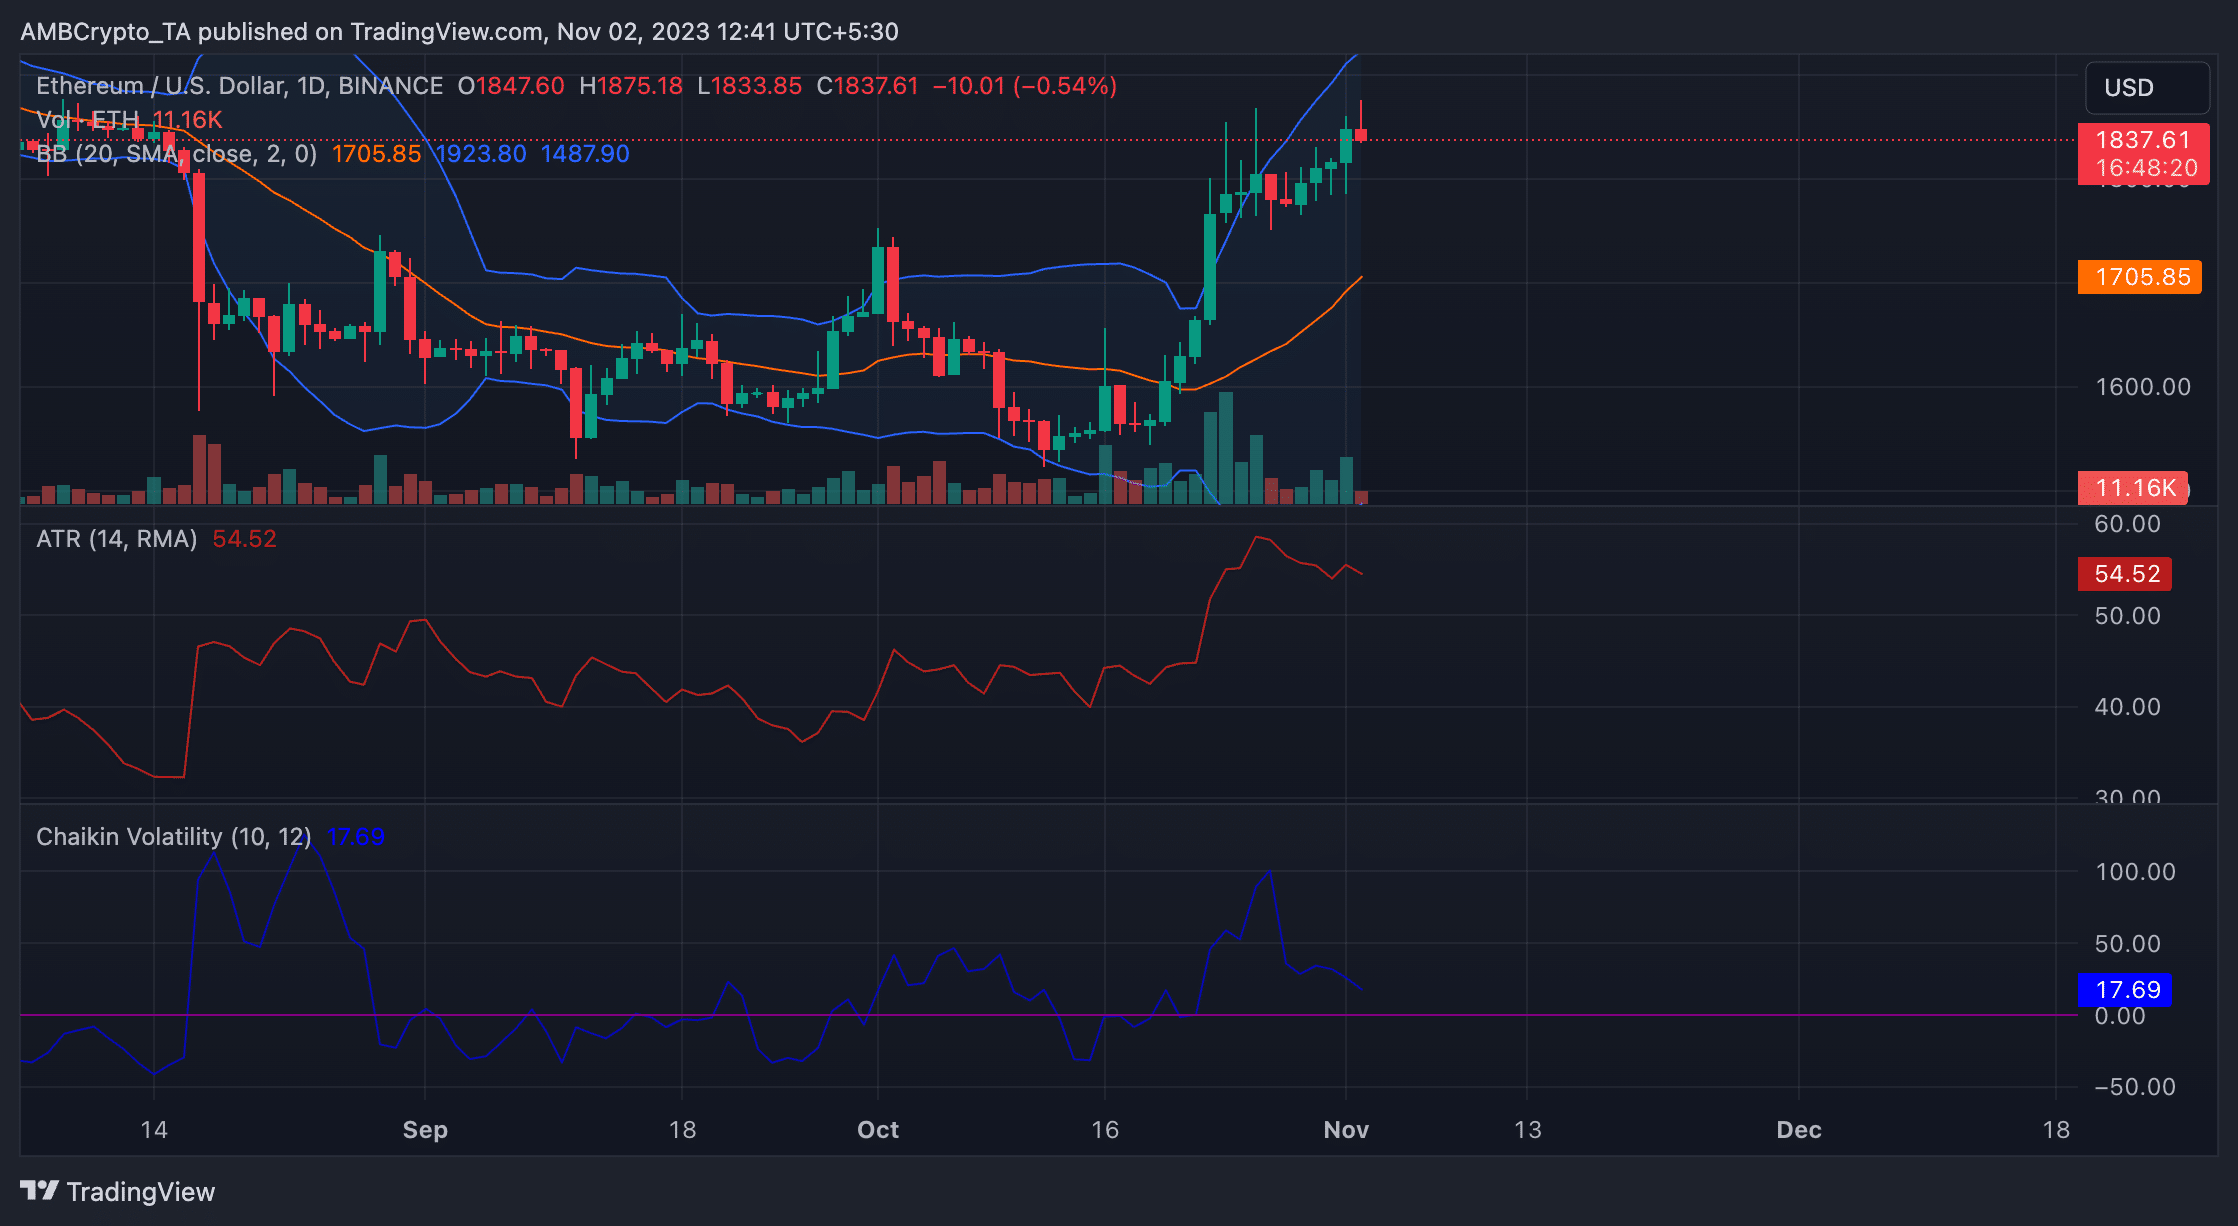
Source: ETH/USD, TradingView