Binance Coin could be set to lose the level of support at $29 to the market’s bears over the next few days after noting a lack of buying volume over the past two weeks. The bullish momentum behind the recent gains for both Synthetix and Nano appeared to have evaporated, and both cryptos could witness a drop to a level of support in the coming days.
Binance Coin [BNB]

Source: BNB/USDT on TradingView
On the 1st of December, Binance Coin closed below the ascending channel it was trading within and retested the same before dropping to find support at the $29-level. However, the wave of selling might not have ended yet.
The OBV showed a downtrend for buying volume over the past two weeks. Combined with the bearish reversal pattern that a close beneath an ascending channel denotes, BNB was likely to lose the $29-support level and drop to $27, the base of the channel, in the next few days.
Synthetix [SNX]
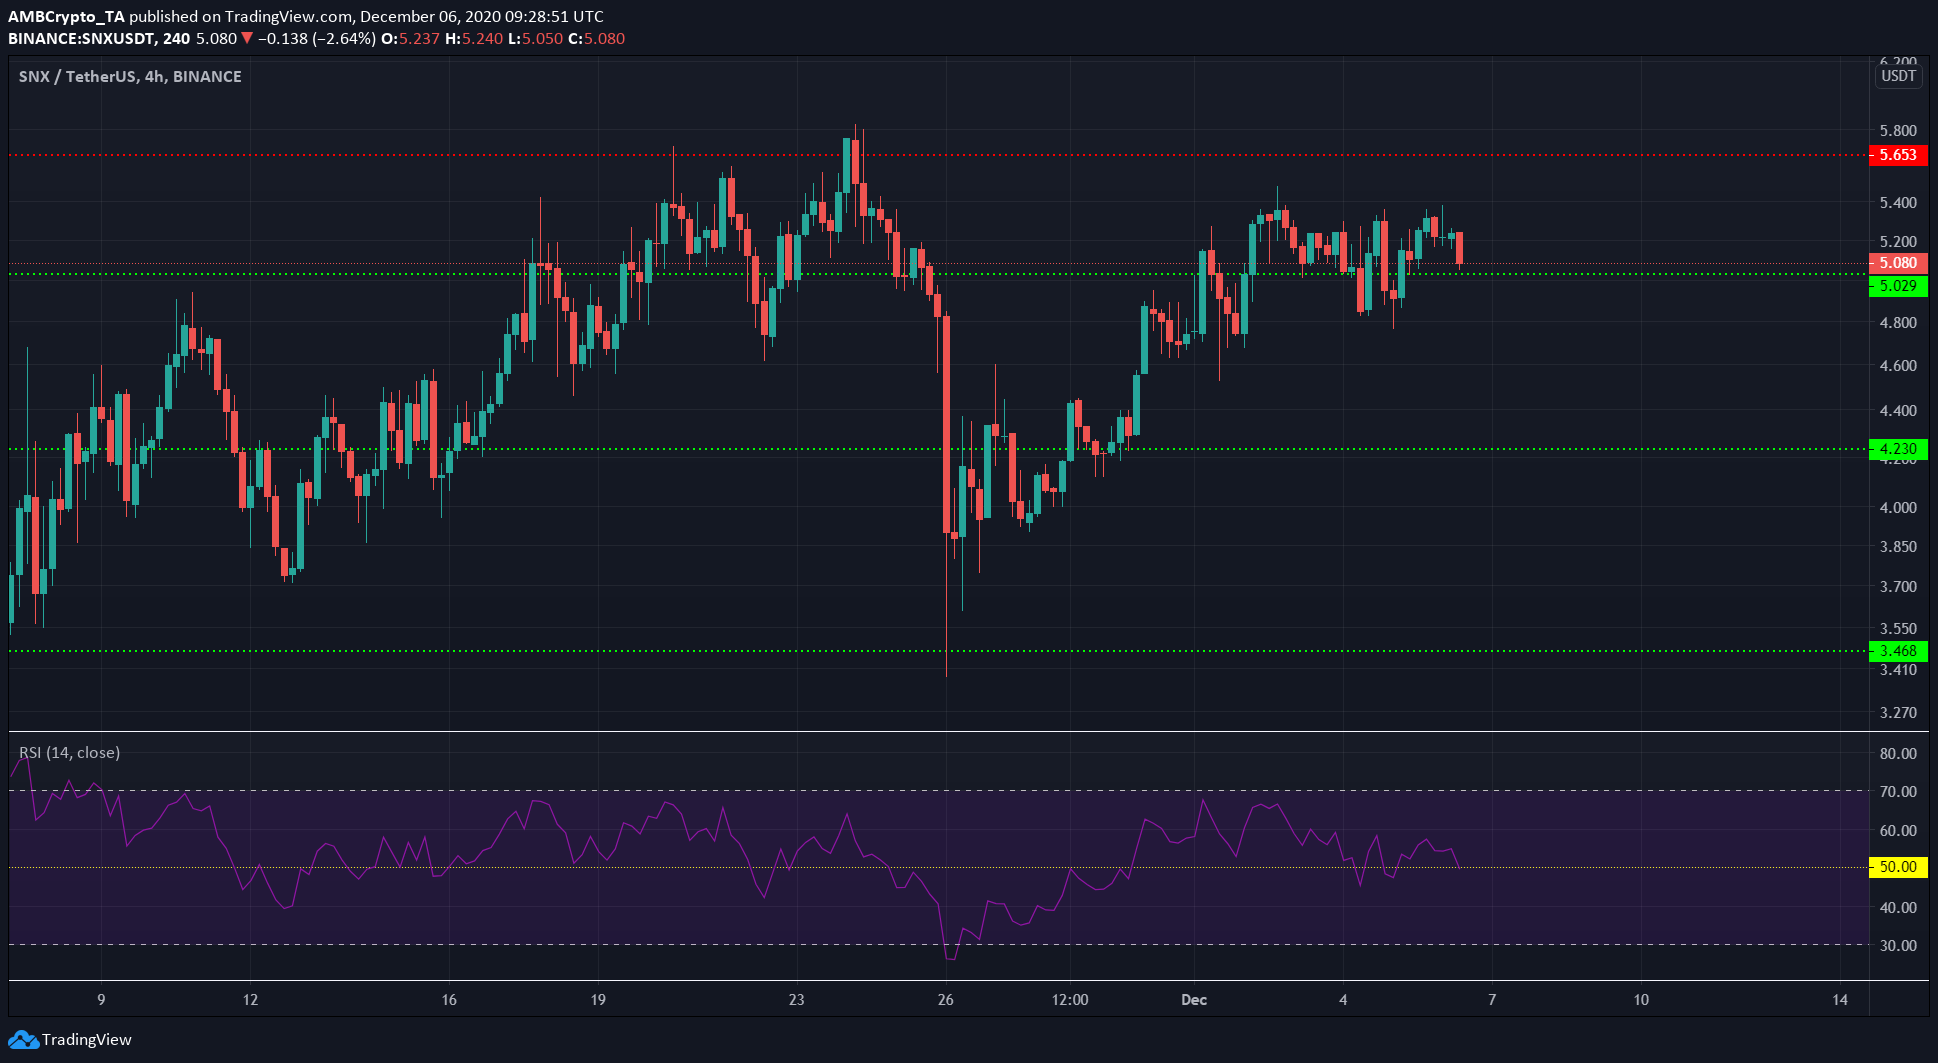
Source: SNX/USDT on TradingView
SNX posted a series of nearly equal highs, while the momentum indicator (RSI) formed a series of lower highs and declined towards the neutral 50-zone.
This showed that bullish momentum behind SNX had dissipated, although the price had recovered most of the losses incurred in the steep drop from $5.75 to $3.87.
In the coming hours, it was likely that SNX would see the $5-level flipped to resistance. At the same time, the RSI would likely test the 50-zone as resistance before another move south to indicate that a bearish trend was in progress.
In other news, Synthetix’s sUSD was listed on Binance’s Innovation Zone recently.
Nano [NANO]
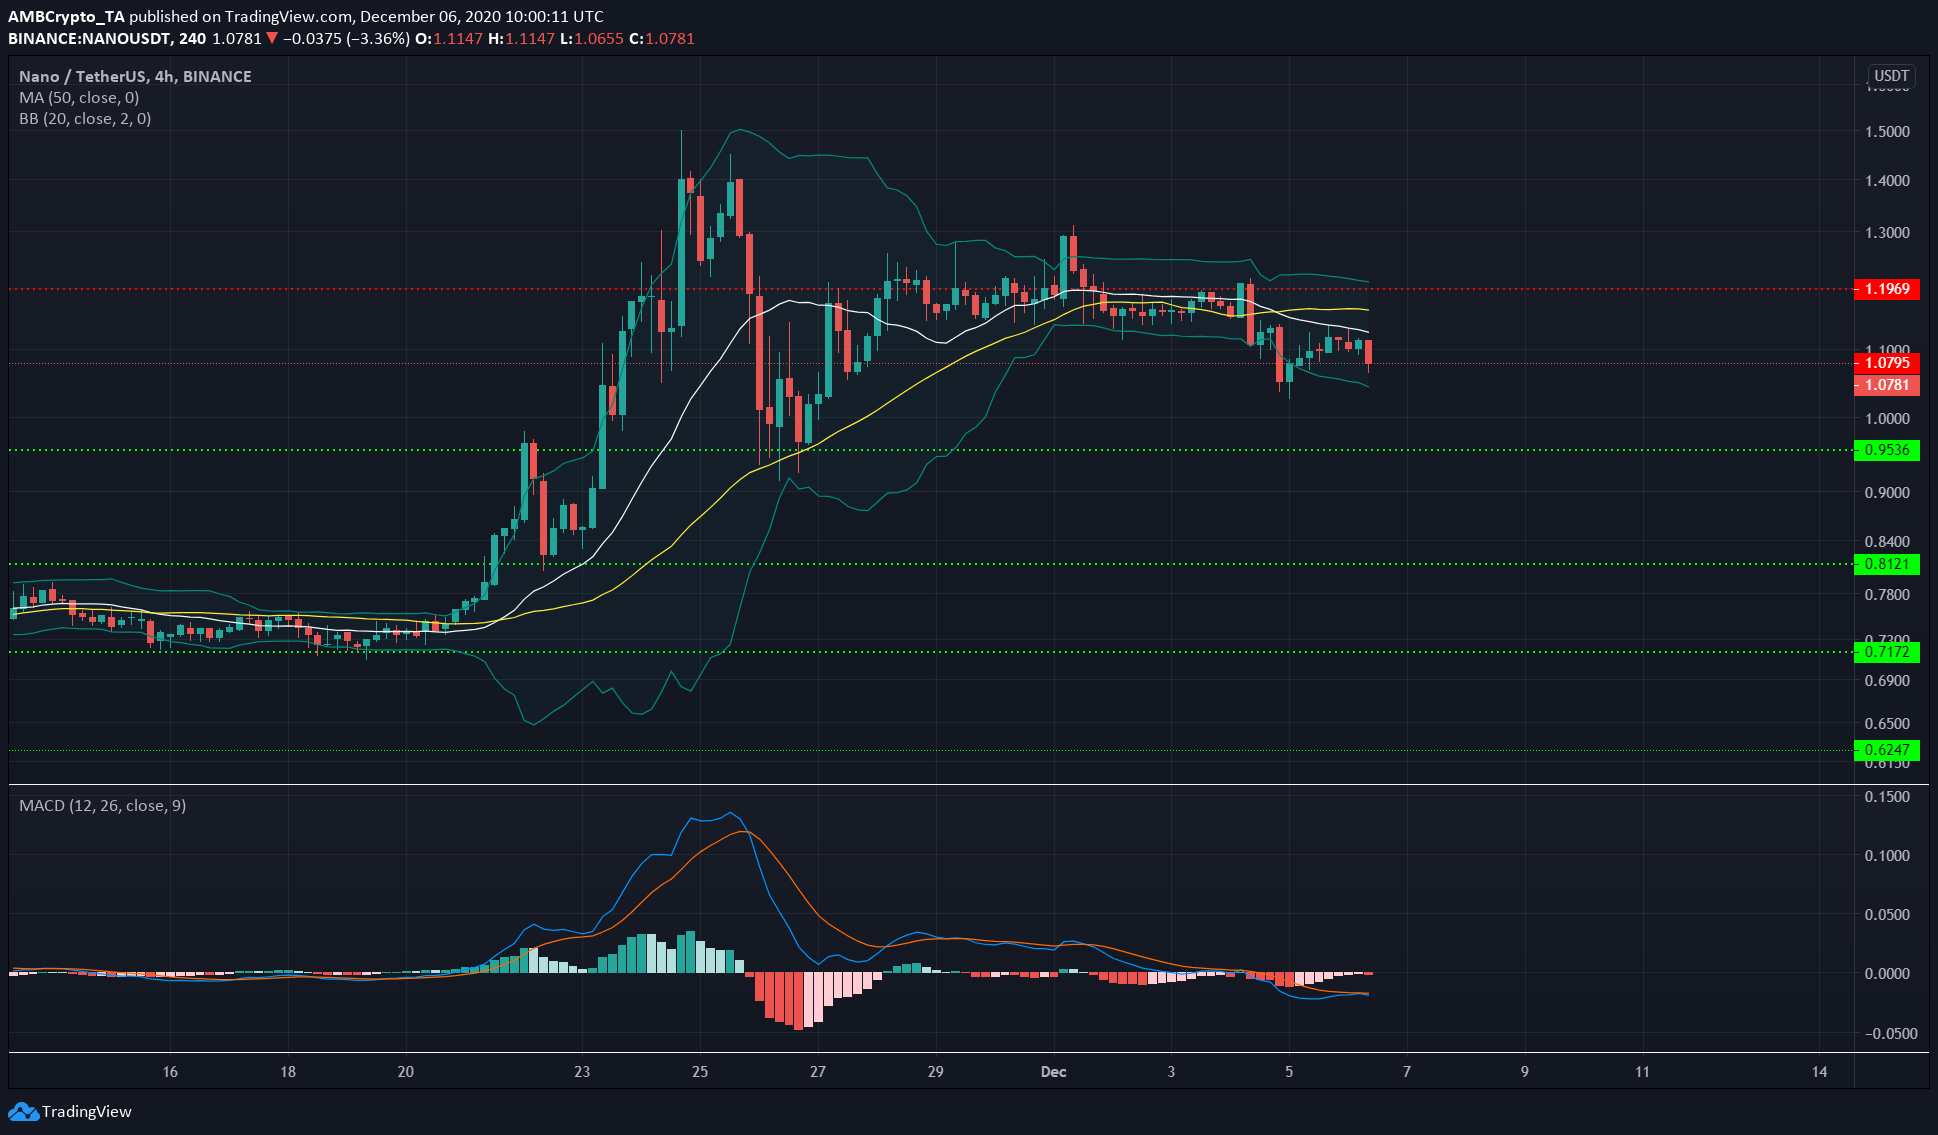
Source: NANO/USDT on TradingView
NANO climbed from $0.73 to $1.4 in the third week of November. The 50 SMA (yellow) acted as support during that move, but in the past week, there was evidence that the bullish momentum had exhausted itself. The MACD showed a lack of momentum in the near-term but was moving under zero on the charts.
While the Bollinger Bands tightened around the price last week, they began to gradually widen recently. Further, the 20 SMA (white) crossed under the 50 SMA.
The past week also saw the $1.19-level flipped to resistance, and NANO could begin to descend to find support at $0.95 in the coming days.