
Disclaimer: The findings of the following article are the sole opinion of the writer and should not be taken as investment advice
Binance Coin has taken long strides in the industry over the past year, not just as an exchange token, but in many ways. The most recent one was its entry into DeFi, which, since then, has allowed projects to be built on it. The long-term prospects of the coin, from the perspective of fundamentals, look extremely bullish. Perhaps, the upcoming bull run will reveal its new ATH and subsequently, its fair value in the bear market.
This article, however, will take a look at the coin over the much shorter time frame of one hour. Over the said time frame, the cryptocurrency seemed to be leaning towards the market’s bears.
Binance Coin 4-hour time frame
Source: BNBUSD on TradingView
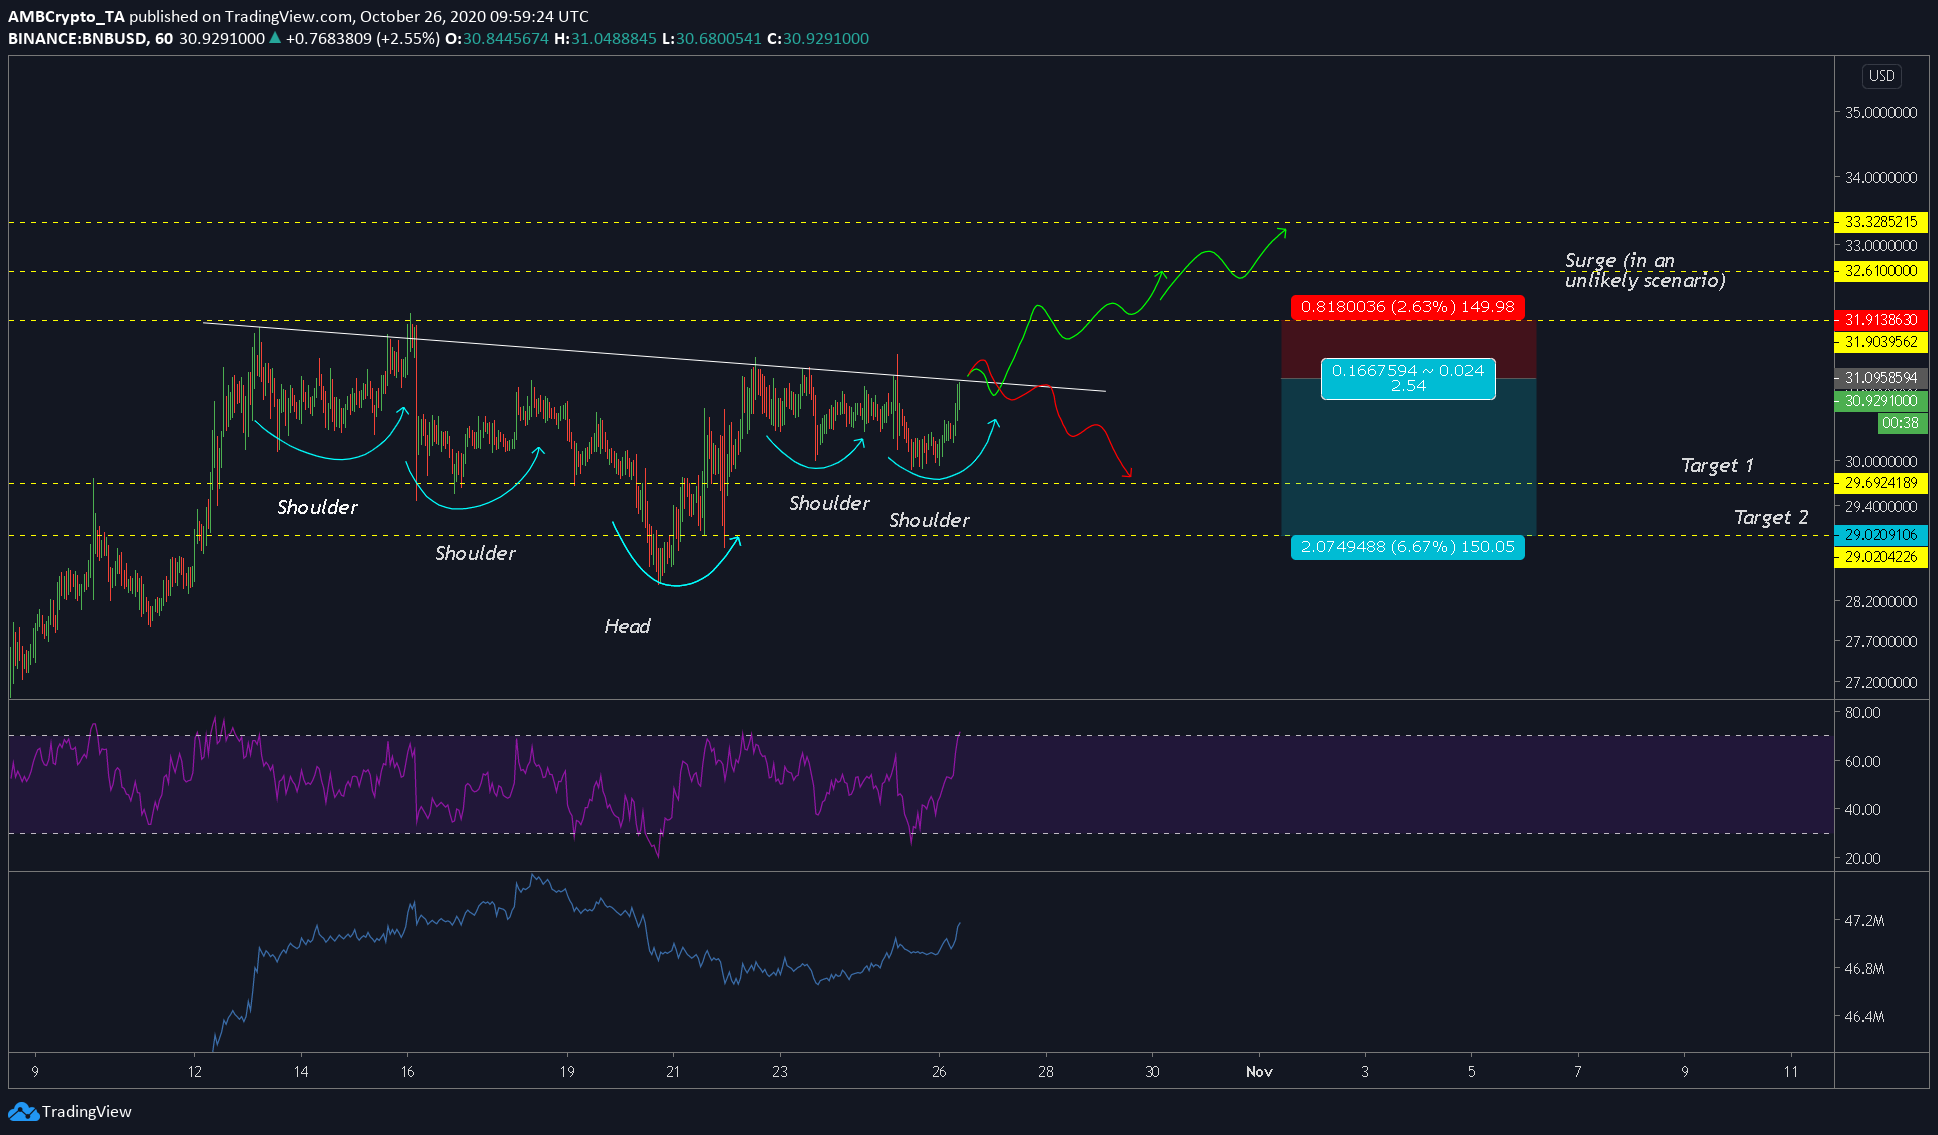
Like many charts, this one has too many parts to it, so let’s take it step-by-step. The pattern illustrated in the attached chart is an inverted head and shoulder pattern. While this is a potential pattern, it might not necessarily break out in favor of the bulls and the reason for this will be explained later in the article.
The said pattern can be considered bullish only if the price breaks above the neckline [white declining line]. Until then, there is the probability that the price may be heading lower, after a tussle with this neckline, hence, making this an important resistance level. Should the price break this neckline, then its trajectory will be as shown above [green squiggly lines]. In case the price fails to do so, it will head lower.
The next part is the position to be taken. At the time of writing, it seemed like being optimistic wouldn’t pay off. Hence, a short position is the best call.
Rationale
The rationale behind this is that there are multiple resistance levels that would prevent the price from heading higher. Other than that, the price OBV seemed to have formed a bearish divergence, hence, we can expect the price to be rejected at the neckline.
Furthermore, the RSI indicator was already in the overbought zone, despite the price being ~3% away from the next resistance level [$31.90]. Hence, it will be hard for the price to breach the neckline and the resistance.
Levels to lookout
The short position would yield better profits with the following levels,
Entry: $31.09
Stop-loss: $
Take-profit: $31.91
Risk-to-reward: ~2.54