Binance Coin short-term Price Analysis: 16 November

Disclaimer: The findings of the following article are the sole opinion of the writer and should not be taken as investment advice
Binance Coin is probably one of the best exchange tokens out there right now. In fact, its year-on-year growth [from 2018 to 2019] was a whopping 522%. In 2020 alone, BNB has noted YTD returns of 102.62%.
While its fundamentals are as strong as ever, the following article takes a look at its short-term price analysis. For BNB’s long-term analysis, refer to this article.
Binance Coin 1-hour chart

Source: BNBUSD on TradingView
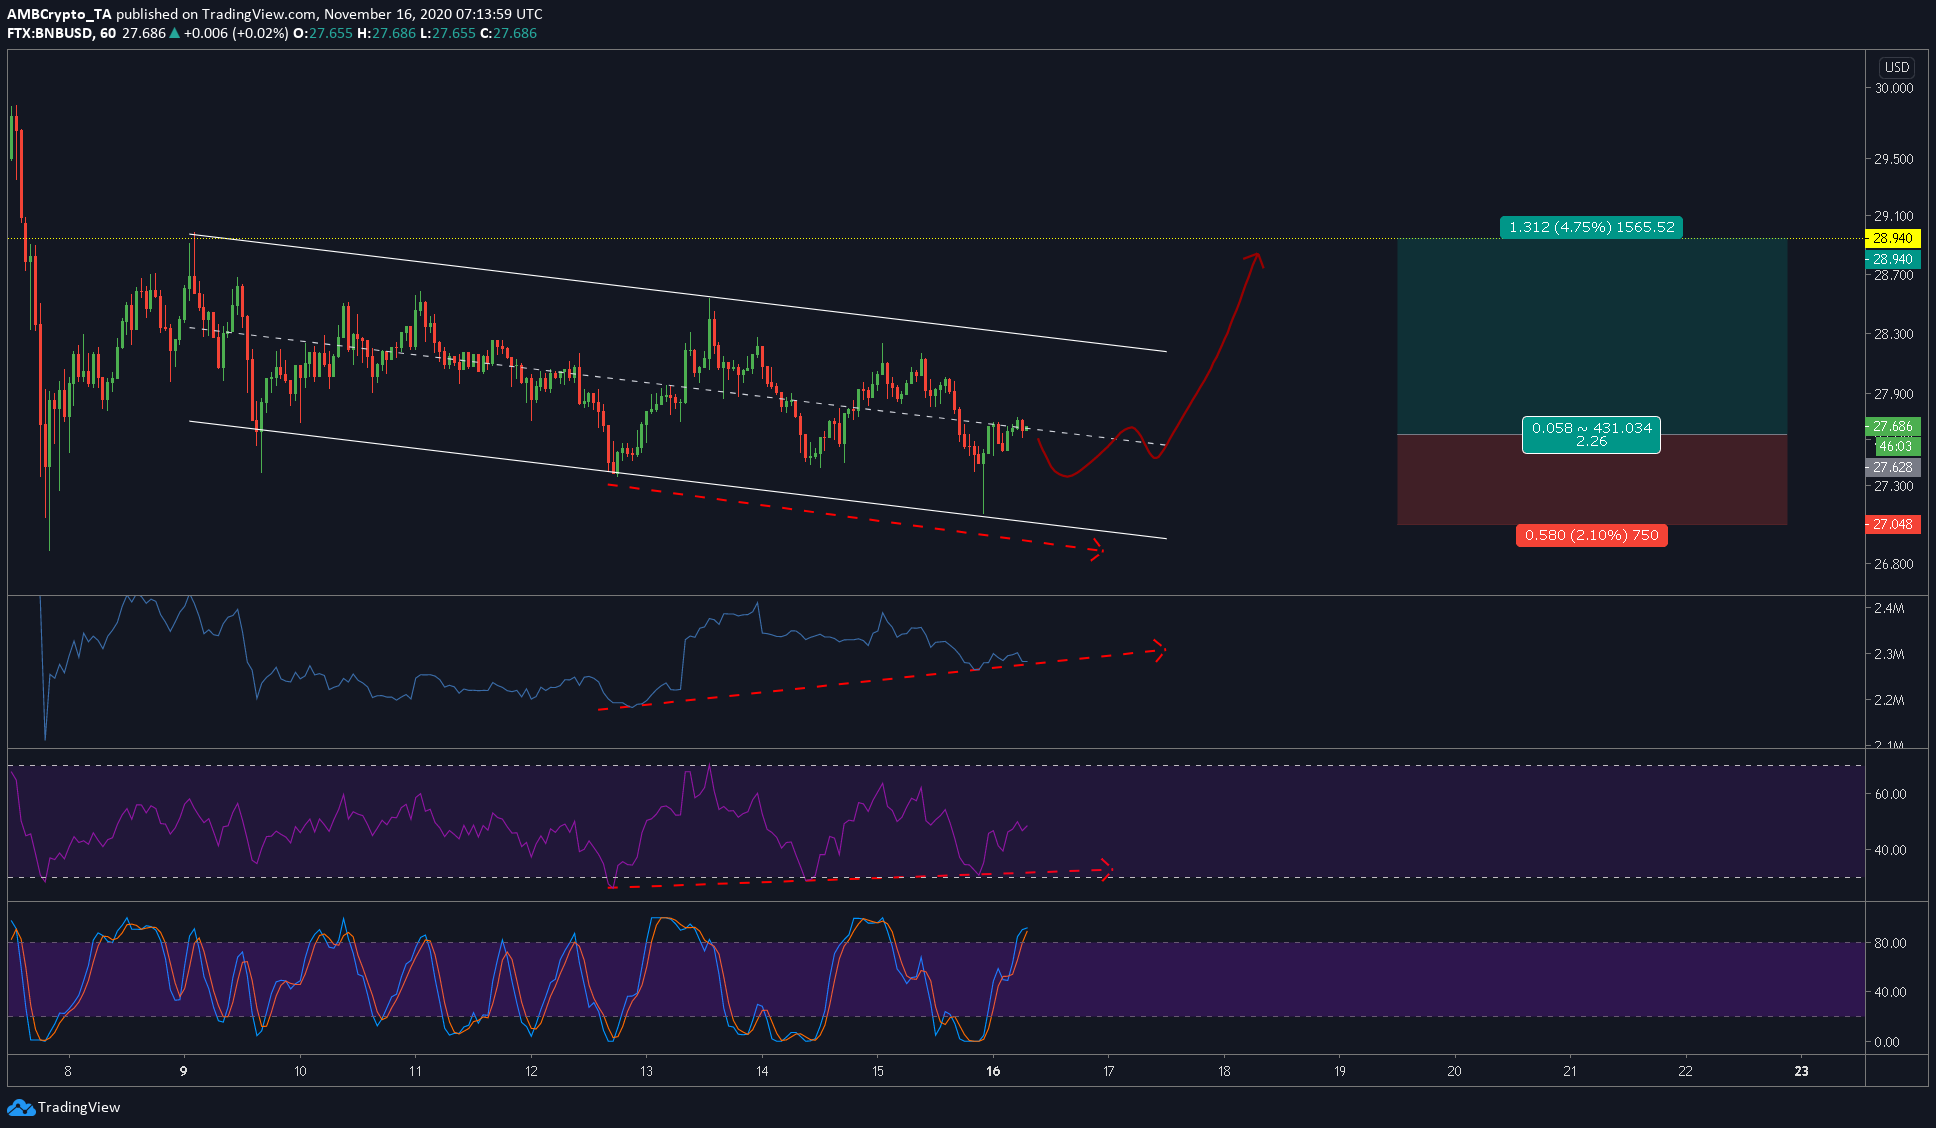
Binance Coin’s one-hour chart showed that the coin was bullish and not just due to a single reason, but due to multiple reasons. This could push the price to $29 and perhaps, a jab at $30, if lucky.
However, before the surge, the price might experience a slight downturn and tussle with a trendline. It should be noted though that this will not affect the end goal – $29.
Rationale
The rationale behind this bullishness is two-pronged – the pattern and the indicators. The pattern that BNB formed was the descending channel. A breakout from this pattern will push the price up to the top of the channel.
The indicators also pointed to a bullish divergence. The volume indicator [OBV] showed that the dropping prices did not match the rising volume. Hence, we can see the price shoot up on the charts soon.
The same goes for the RSI as the rising bullish momentum did not sit well with the dropping prices.
Levels to look out for
Entry: $27.628
Take-profit: $28.940
Stop-loss: $27.048
Risk-to-Reward: 2.26
Finally, it must be noted that the Stochastic RSI was overbought. However, the Stochastic RSI does not have enough weight to affect the price, at least as much as the OBV and the RSI.
Hence, we will soon see a small downtrend, one that will be at the test of the central trendline of the channel. A small pullback from here should set up the price for a surge as shown in the attached chart.
As an alternative, if the price does break below the stop-loss, a position with similar targets can be opened from the bottom of the channel with appropriate stop-loss.


