
Binance Coin, a native token created to help traders pay for fees on Binance has comfortably established its position in the top-10 crypto this year. During mid-September, the digital asset was able to register its all-time high valuation of $33.83 but within a week, it shed more than 30%, dropping down to $22 on 21st September. Since then, the asset has been able to recapture its bullish momentum, rising above $30 yet again.
At press time, the asset was placed 6th in the rankings with a market cap of $4.5 billion.
Binance Coin 4-hour chart
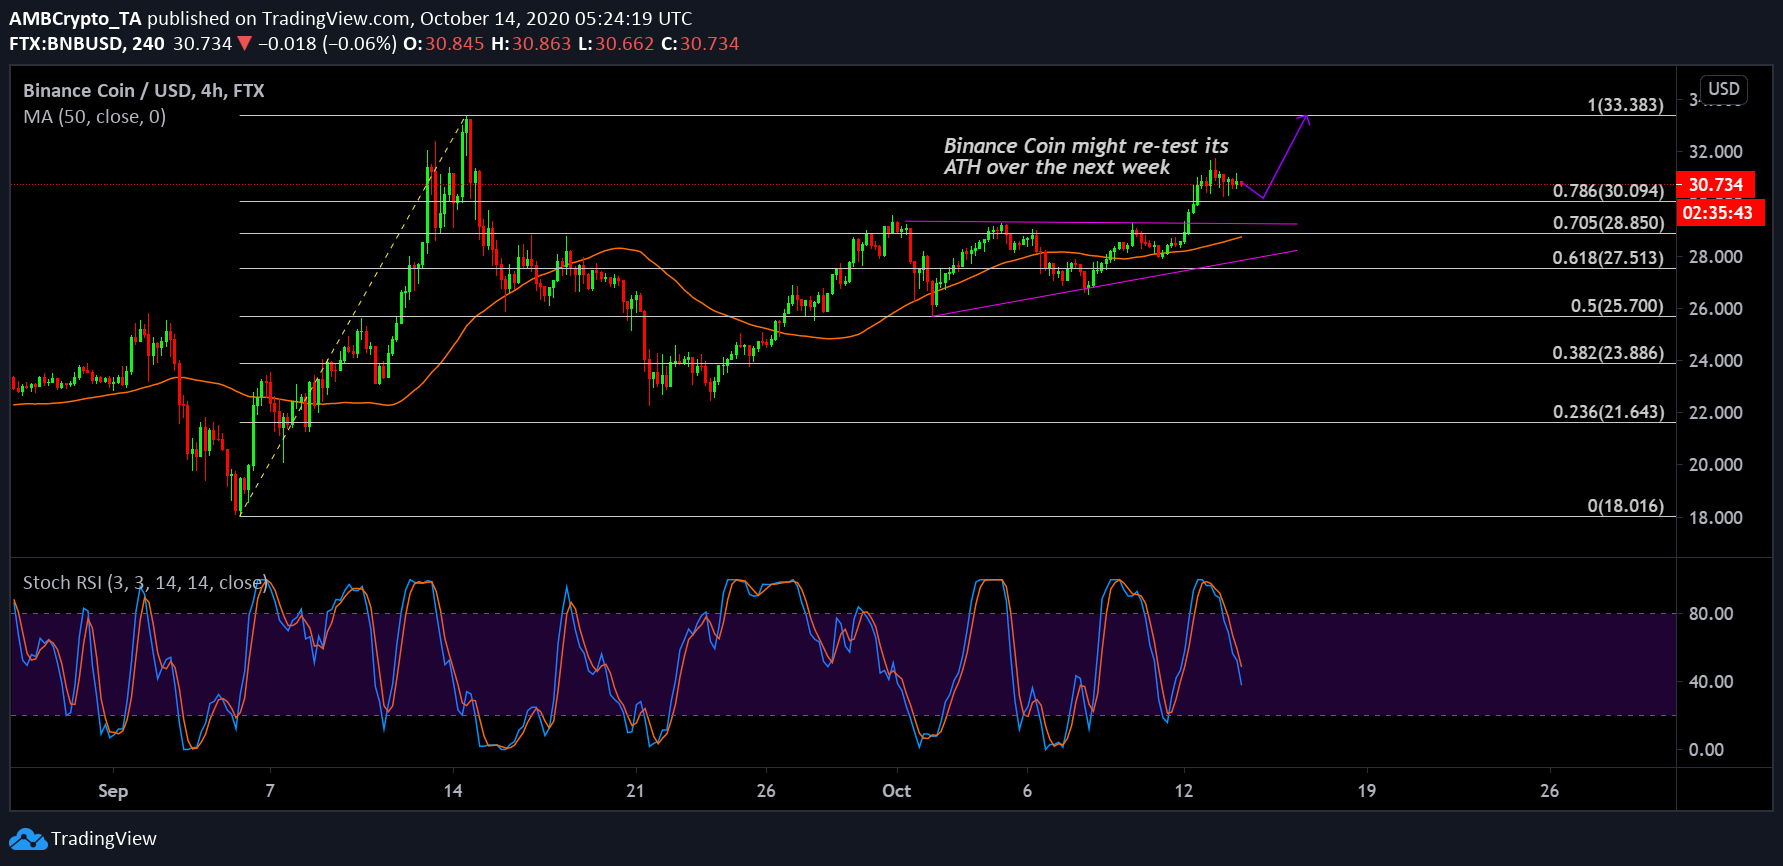
Source: BNB/USD on Trading View
While the 4-hour chart attests to a mid-term price direction, it is essential to understand the key levels for Binance Coin in the short-term chart. As pictured in the above analysis, BNB token is currently consolidating its position right above the 0.786 Fibonacci line ($30.094), which meant that the next price target for Binance Coin remains its all-time high price. While the consolidation needs to take place for at least another 24-hours to attain strength, these were strong signals for another bullish wave.
Taking support from the underlying 50-Moving Average, the price might as well re-test the resistance at $33.83 within the current week, if bullish momentum kicks in.
Stochastic RSI suggested that the bears were temporarily controlling the price direction, but a reversal is bound to take place as the blue line approaches the oversold region.
Binance Coin 1-hour chart
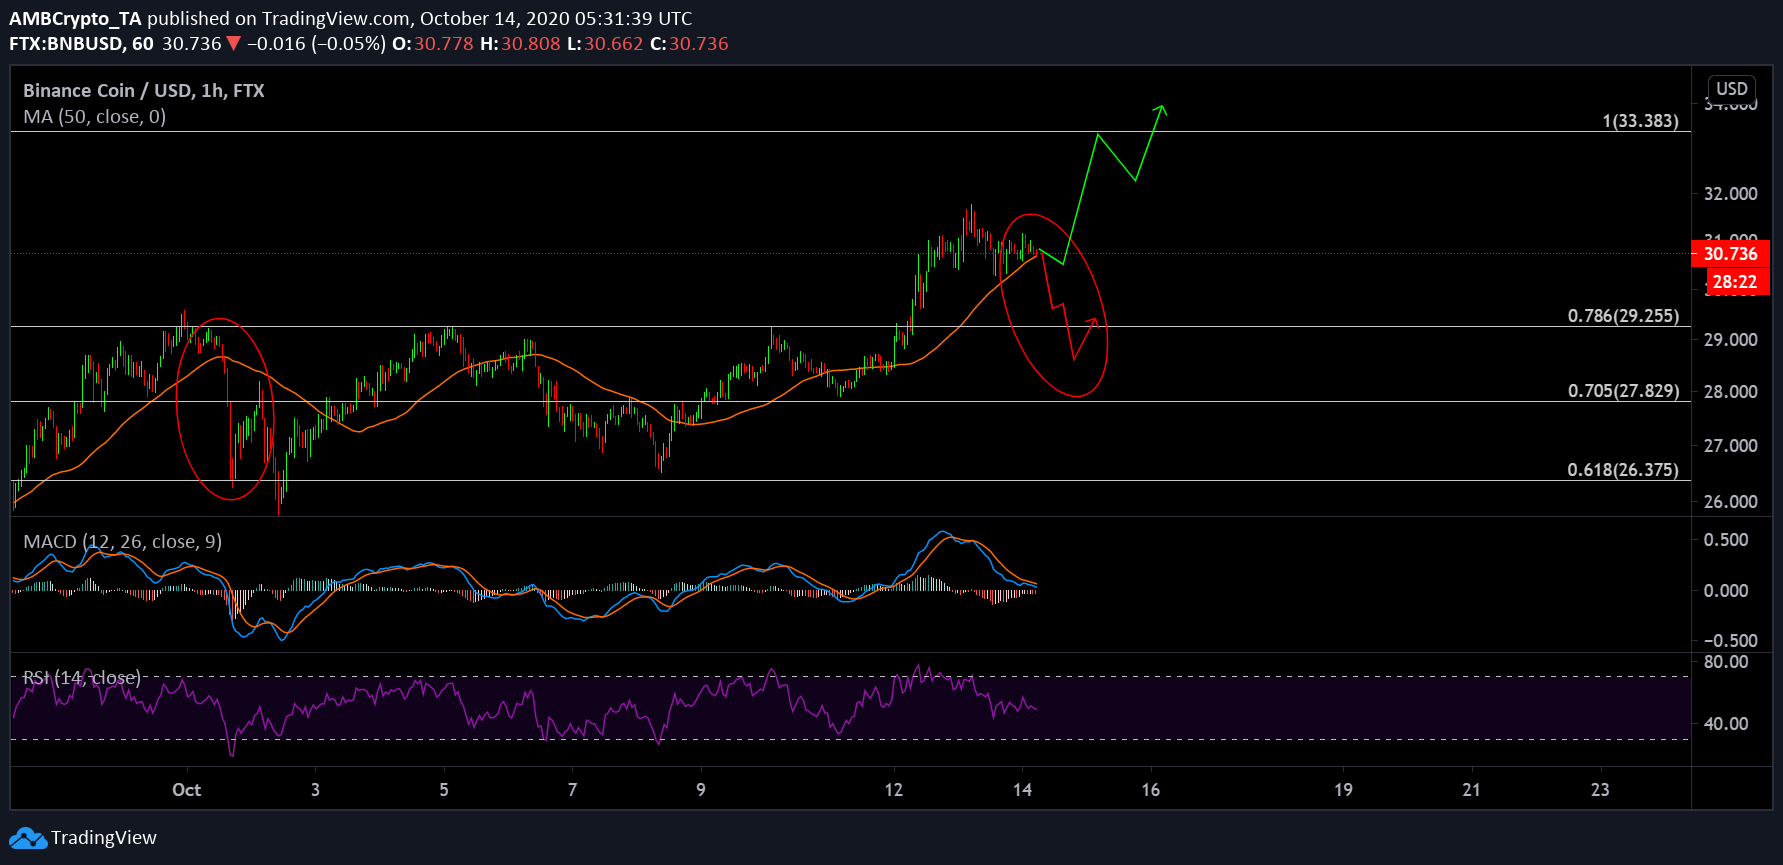
Source: BNB/USD on Trading View
While on the mid-term, Binance Coin may as well proceed towards another ATH, the 1-hour chart indicated a historical dilemma. During the start of October, a flash crash was witnessed after the price was seen re-testing the 50-Moving Average as support. A similar situation is taking place at the moment, and an unsuccessful move upwards might actually lead to further depreciation down to $28-$29.
On the other hand, if the price bounces from hereon, the chances of a re-test at $33.83 rises exponentially as the token will receive a boost from successfully bouncing off the 50-MA. Market Indicators were supportive of a price pump.
MACD suggested that the blue line was very close to completing a bullish crossover with the orange line and RSI suggested that buying pressure was pushing down on-sell pressure at the moment.
While both the red and green path might unfold in the next few days, the volatility associated with BNB token is bound for movement, whether it is bullish or bearish.