
Binance Coin now finds itself on the fringes of the top-10, occupying the 10th spot owing to the consolidating movement of the new entrant Chainlink following its recent surge. With a market capitalization of $3.15 billion, the exchange token is only a few million ahead of Crypto.com in eleventh with a market cap of $3.11 billion.
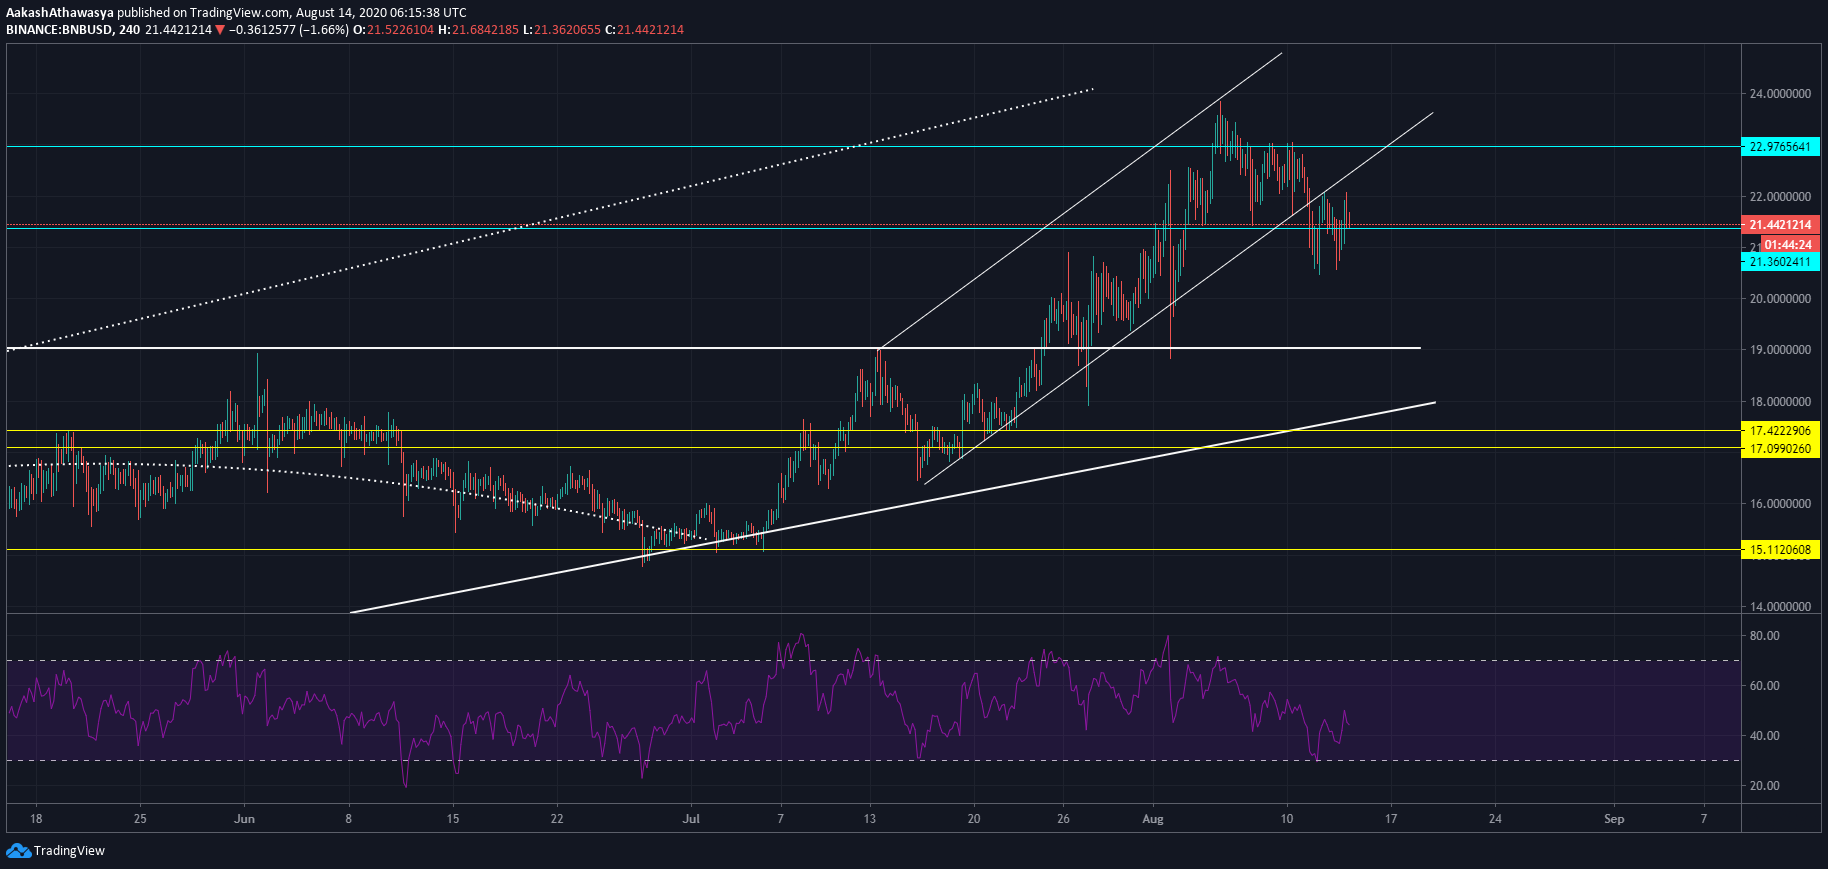
Looking at the short-term price of Binance Coin all hope is not lost despite the bearish performance early in the week. After dropping down from a price of $23.76, the resistance at $22.97 pushed the price as low as $20.5 before a minor rebound saw it jump to its press time price of $21.76. This drop which began on August 9 has dropped the coin out of its upward channel that began on July 18 and was accelerated by Bitcoin’s move over $10,000 at the end of July and into August.
On the larger time-frame, the upward channel which began during the March drop is still alive and well. However, because of being an upward channel, the support level, and the resistance, are constantly rising. The latter, in the larger upward channel is at $17.51, which marks a difference of 17 percent i.e. if the price drops by 17 percent, the larger upward channel will be exited. At the beginning of the week, the difference between the upward channel support and trading price was 27 percent, further emphasizing the extent of the price decline in relation to the rising chart pattern.
Source: BNBUSD via Trading View
Between March to June, a similar trend was playing out with the price moving in an eclipse. From March to mid-May the price quickly rose from $9.05 to $17.42, and then dropped down to the support at $15.11 in early July. Even before Bitcoin’s move up, BNB was trending higher and then the former’s anchoring move saw it push the latter to a six-month high over $23 for the first time since February.
At press time the Relative Strength Index of the exchange token is fairly languid, trending higher but with bumps and is placed at 45.07. Since the beginning of the month, Binance Coin’s RSI has been consistently dropping from the overbought zone above 70 down to the oversold zone at 30 on August 12 to around 40-45 in the past few hours, indicating waning investor confidence.
With one channel exited the larger upward channel looks to hold the price of the exchange token but the difference allows the price a large room to work with. If the 24-hour trading volume, which stands at $294.8 million falls, then RSI is sure to take a hit and the price will inch lower and lower by the day. If this does transpire, support levels at $19 will hold strong like it did for the previous quarter and prices will rebound upwards. Hence, be watchful for the $19 to $21 range.