
Crypto Fear and Greed Index dropped from 75 to 61 as Bitcoin was quite volatile the previous day, going as high as $13,250 and dropping to as low as $12,785. This could have spooked some traders and shifted sentiment from euphoria to a little less ecstatic. Binance Coin posted strong gains. IOTA exhibited a bearish divergence and failed to break out to the upside, and Synthetix exhibited a bearish pattern on the charts.
Binance Coin [BNB]

Source: BNB/USDT on TradingView
Using the Fibonacci Retracement tool for BNB’s early September surge from $18 to $33, some important retracement levels (white) were noted.
BNB bulls were able to defend the 23.6% retracement level at $29.75 and were even able to push the price past a region of resistance at $30.5.
The $31 mark was important, as a rise above it could propel BNB toward $31.9 and perhaps even $32.6.
The RSI also showed bullish momentum for the coin as it showed a value of 63.
IOTA
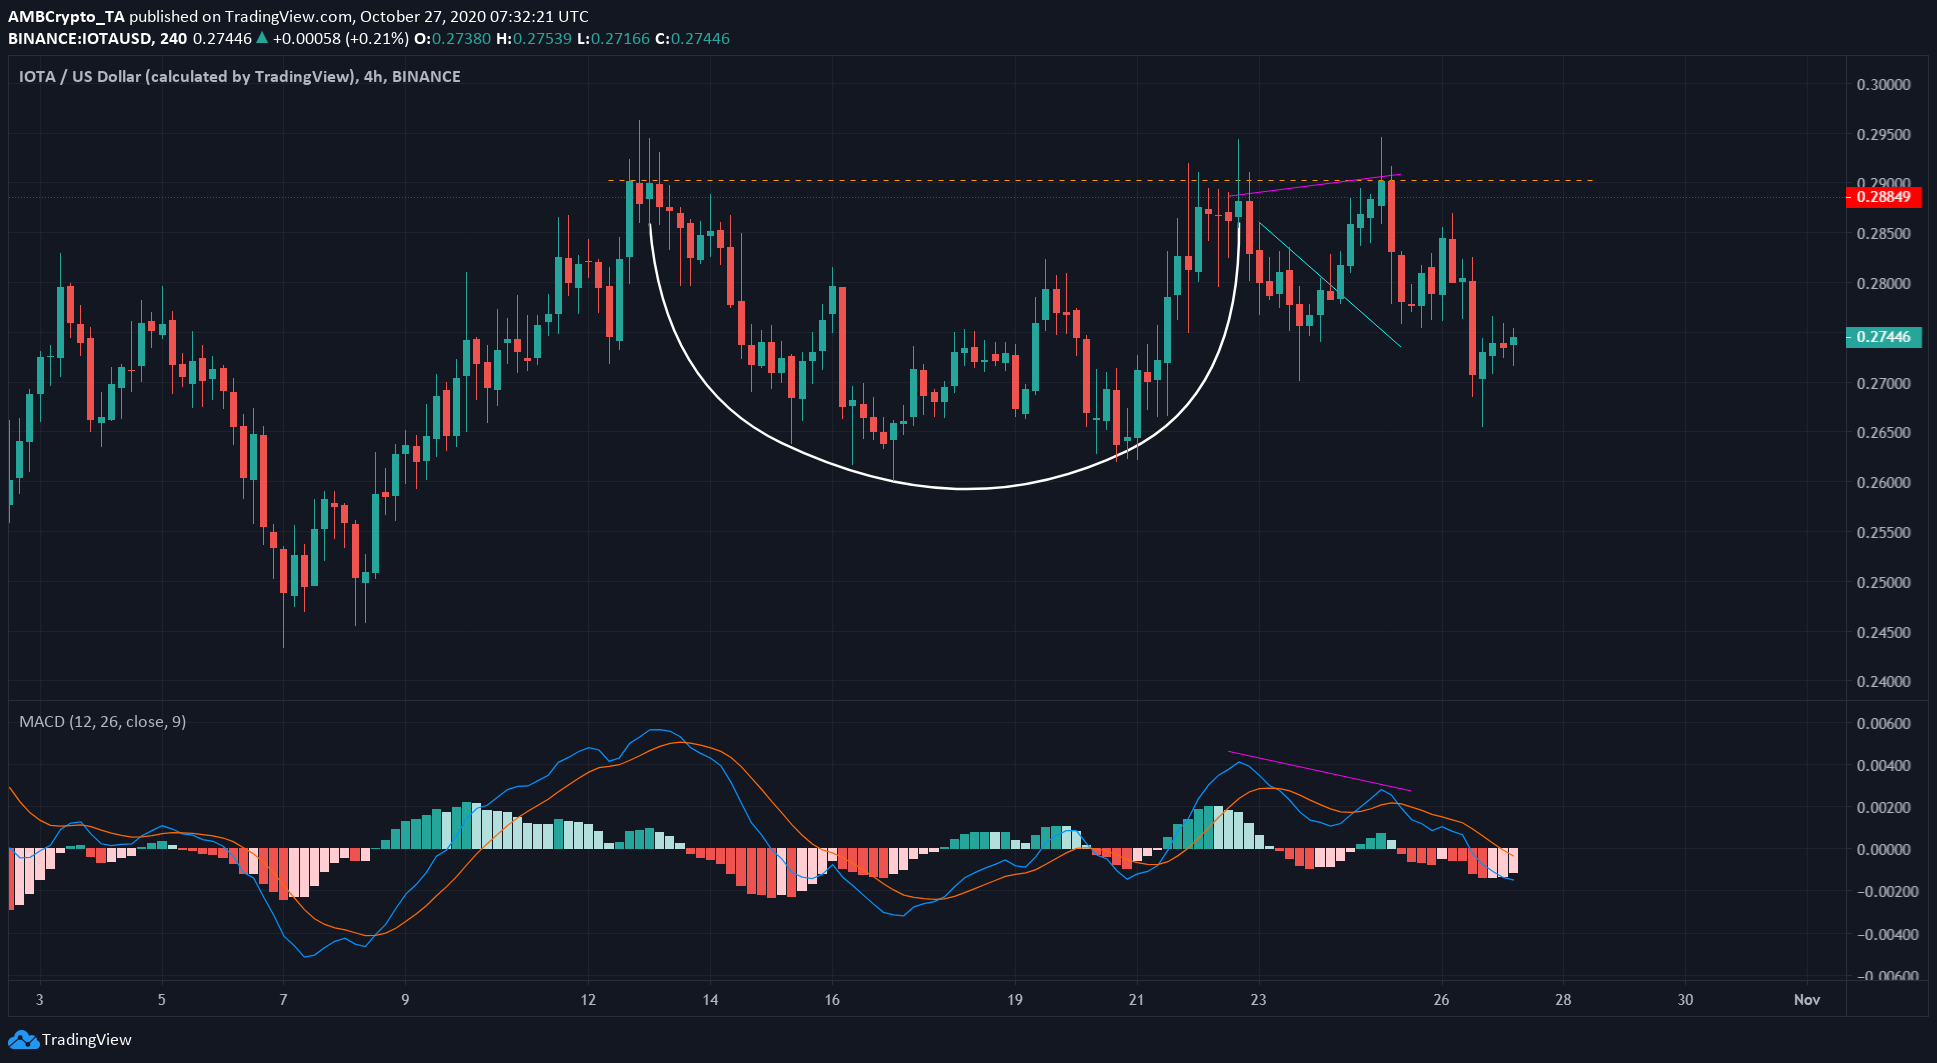
Source: IOTA/USD on TradingView
IOTA formed a cup and handle pattern (white). The rim of the cup was at $0.29 (orange, dotted). However, just as IOTA reached the breakout point, there was a divergence between the price and momentum.
This divergence (pink) was followed by IOTA posting losses and can expect to find support at the $0.265 level.
At press time, the MACD indicated strong downward momentum, as the bearish crossover it had formed recently was moving beneath the zero line.
Synthetix Network [SNX]
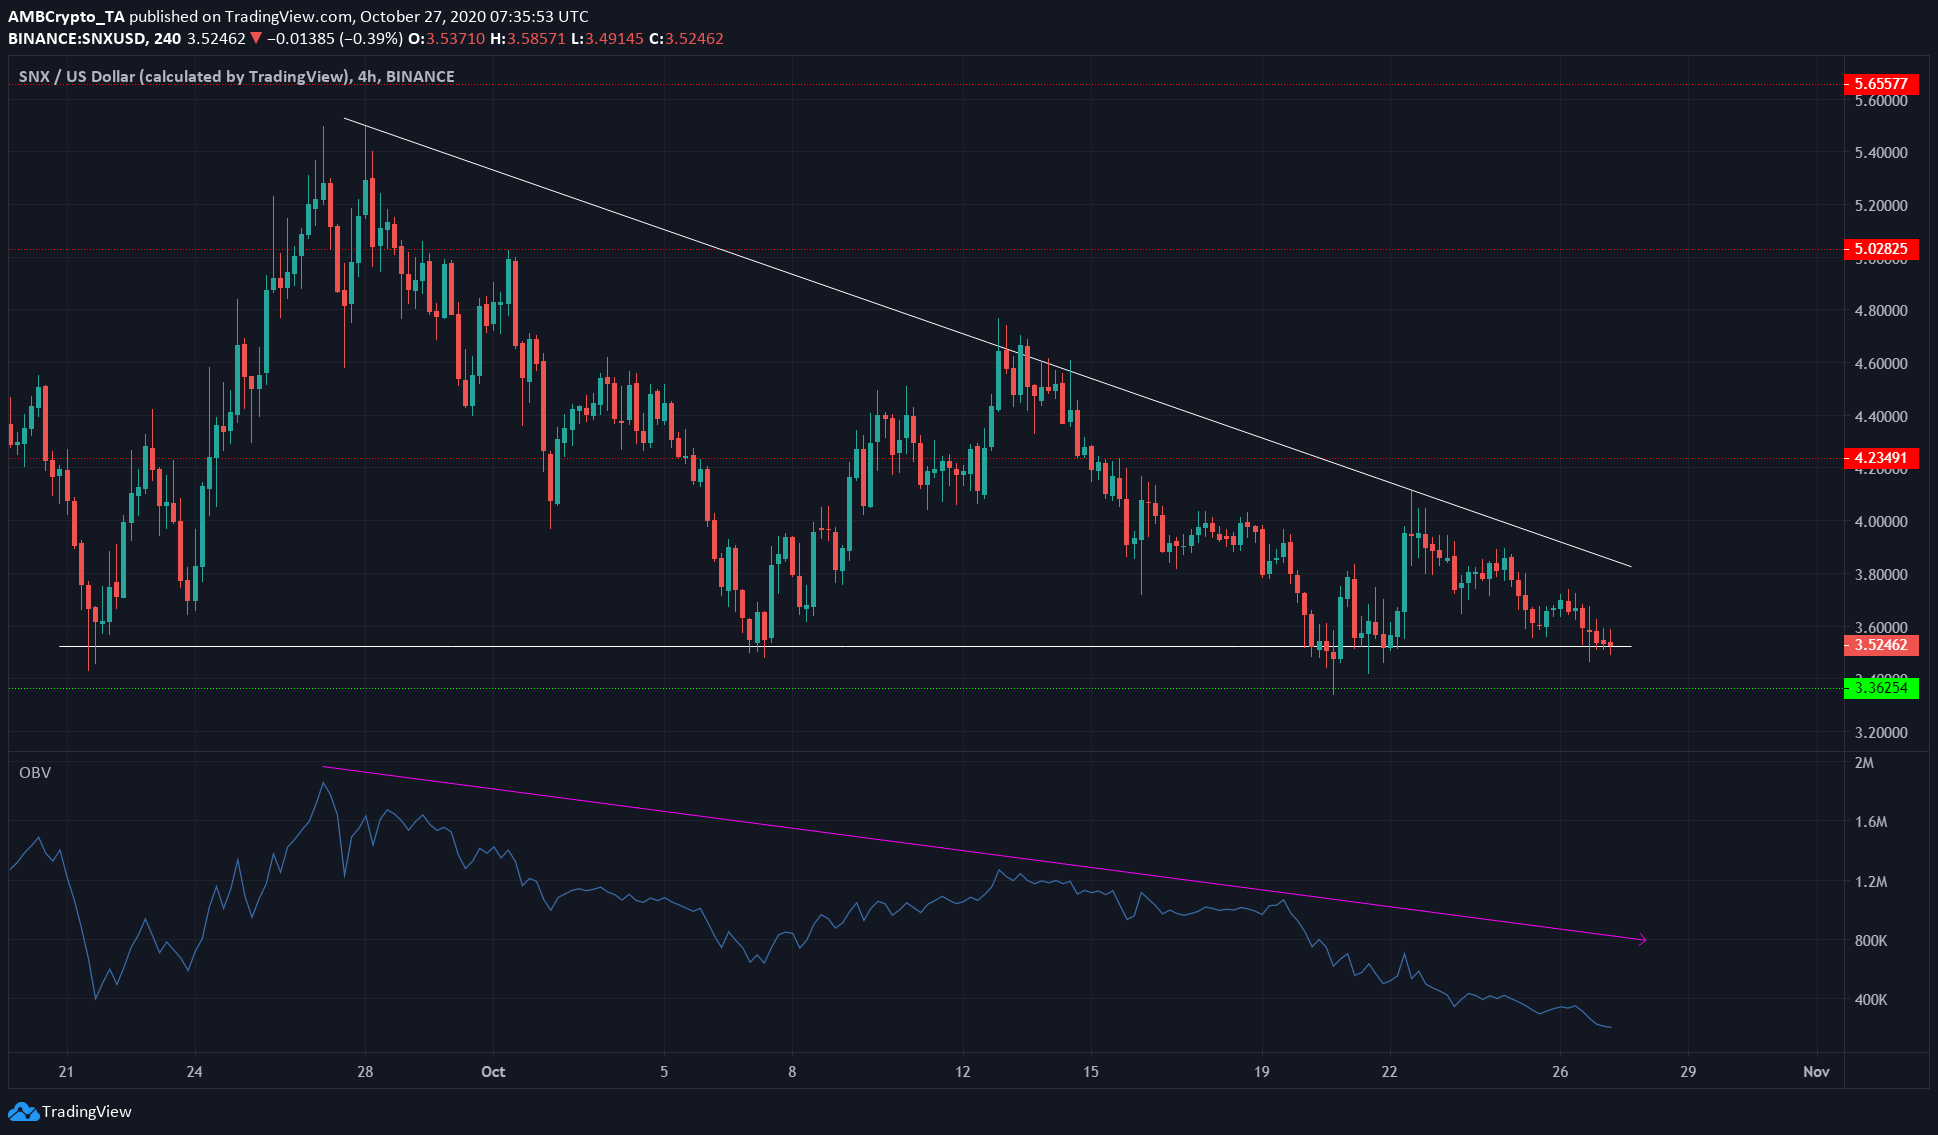
Source: SNX/USDT on TradingView
Synthetix was forming a descending triangle pattern (white), a bearish pattern that generally sees the price break down beneath the base of the triangle.
The OBV also highlighted the lack of buying volume behind the asset, signifying that sellers were dominant.
SNX could drop as low as $2.84 or $2.6 in the next week or two if it closed beneath the base of the triangle, and beneath support at $3.36.