As election frenzy grips US, how will Bitcoin’s price react?

Early voting saw a huge turnout in the USA and this can be attributed partly to the COVID-19 pandemic. The turnout rates could be higher than in any US presidential election since 1908 and as this frenzy ensues, the crypto market witnesses a bloodbath. However, currently, Bitcoin and ETH are holding stead with less than a 1% drop in price in the past 24 hours.
Bitcoin is above $11.3k and with increasing inflow to exchanges and its volatility may increase. The price may possibly hit $11.5k or go even higher.

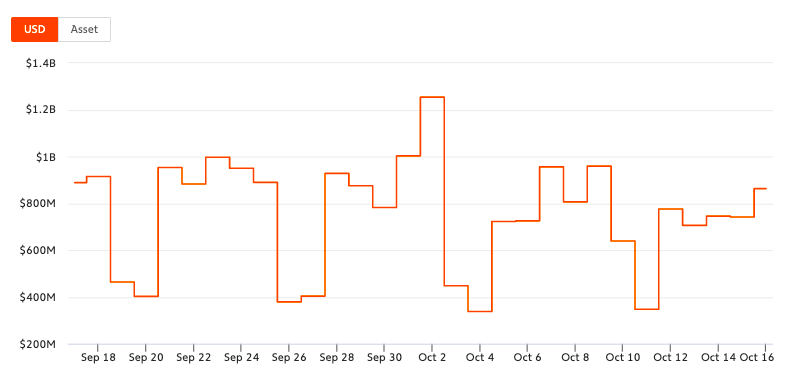
BTC inflow to exchanges || Source: Chainalysis
Based on data from Chainalysis, BTC inflows to exchanges in the last day are 75.78k BTC, close to the 180-day average. The inflow has increased nearly 4 times in the past week. With more Bitcoin hitting spot exchanges, the current funding rate which is zero or near zero may turn further negative.

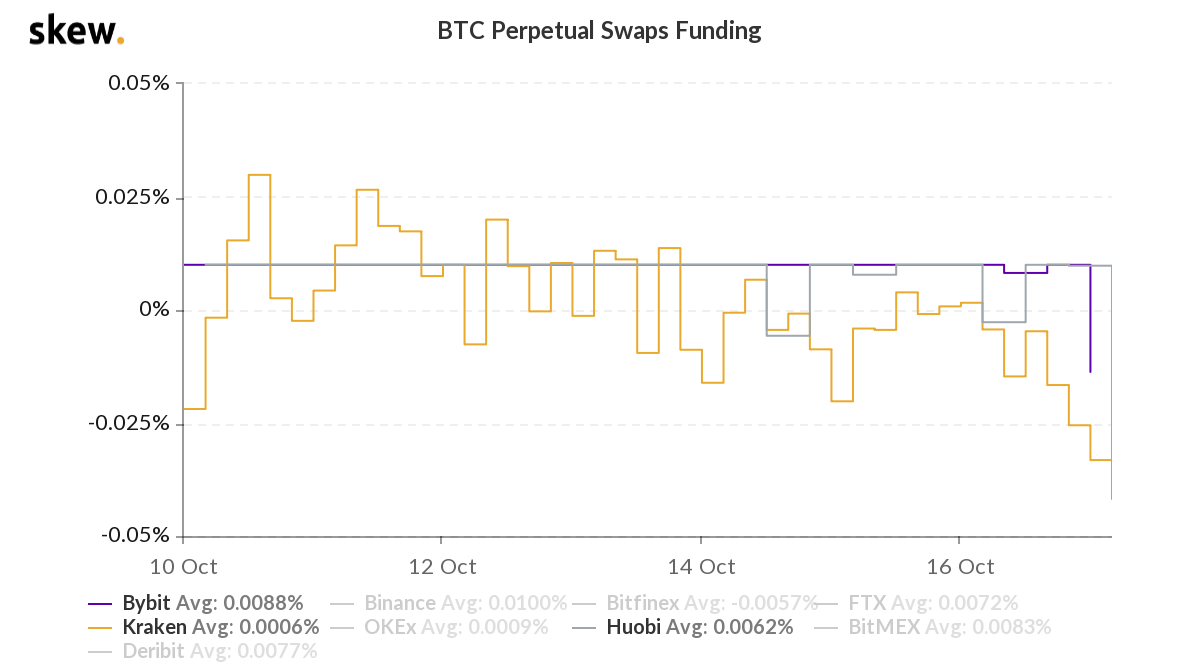
BTC Perpetual Swaps Funding || Source: Skew
On exchanges like Huobi and Bybit the average is near zero. With an increase in trade volume on these exchanges, the funding rate may hit may drop down under. At the current funding rate shorts are paying for longs. On Huobi Futures it is neck to neck. Liquidated shorts and longs are $11 Million each.

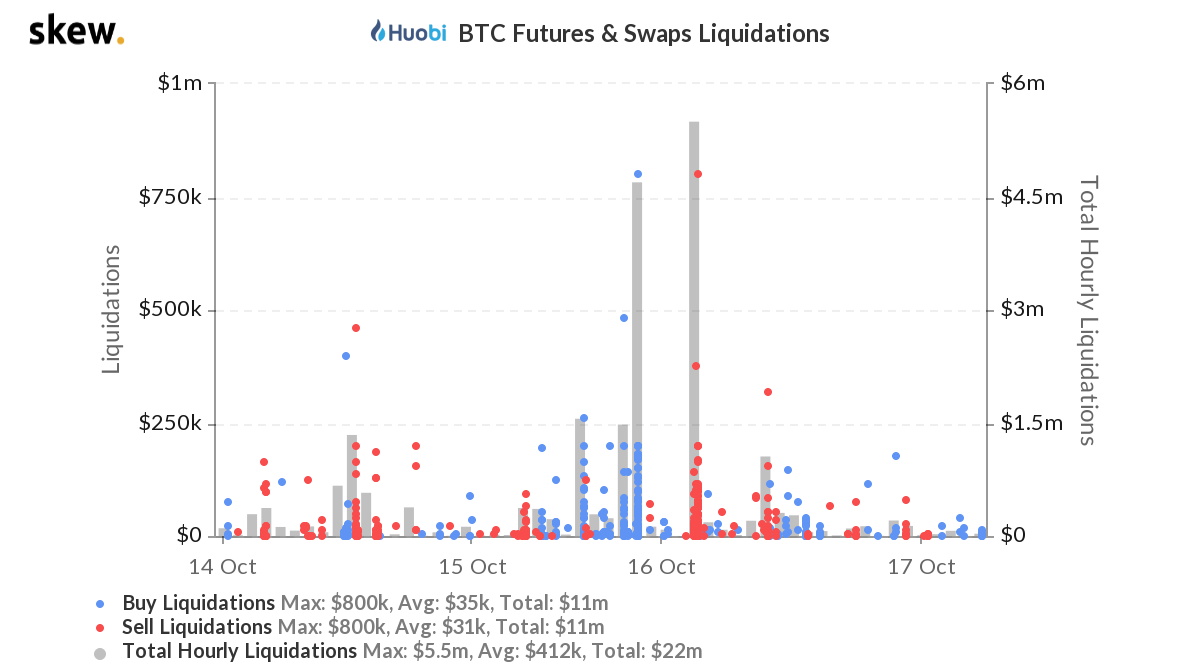
BTC Futures and Swaps Liquidation || Source: Skew
The chart from skew shows the liquidations over the past 3 days however over the past week the pattern was the same. Unless the funding rate increases on the positive side, longs may take over shorts. Another important indicator is the Accumulation chart. Currently, there is an accumulation happening above $10k and at the current price level.

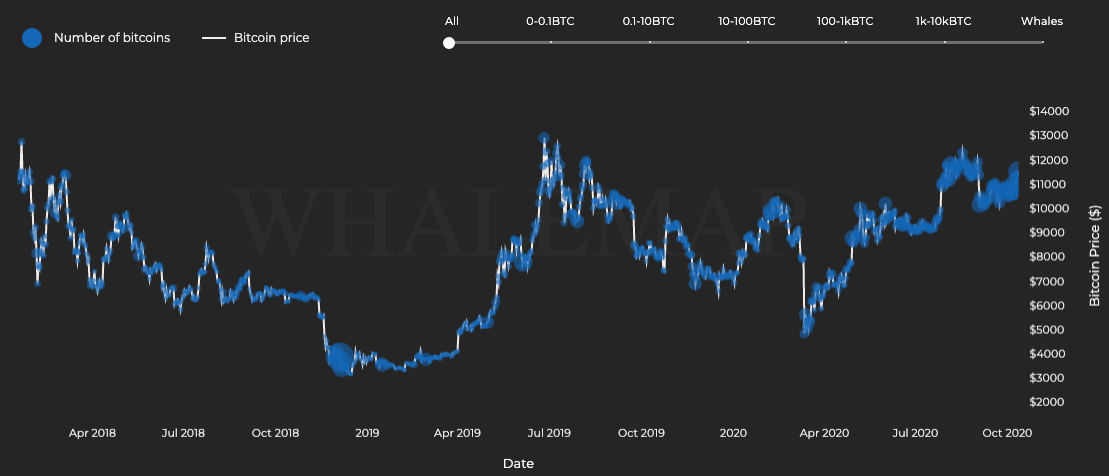
Accumulation of BTC Chart || Source: Whalemap
Based on the above chart, there is accumulation on almost all levels however, above $10k it has been the highest YTD. This hints towards an increase in price as the accumulation phase is followed by a price rally, as supply falls short and sell-side pressure is built up. Not just retail traders, Institutions are accumulating. A high % of miners have been HODLing for the past few weeks.
Price trends are changing and just as BitMEX’s news caused a drop of less than 3% in Bitcoin prices, OKEx’s news may cause no major change. The election, however, irrespective of outcome is driving retail traders towards crypto and the market capitalization is expected to increase further into November 2020. With increased inflow to exchanges, there is a possibility of Bitcoin hitting another ATH, and election results may nudge it in the right direction.
