Bitcoin Cash Long Term Price Analysis: 25 November

Disclaimer: The findings of the following article attempt to analyze the emerging patterns in Polkadot’s short-term market and its impact on the price
Bitcoin’s hard fork, Bitcoin Cash has been surfing through various resistances and has appreciated in value. Currently, the asset’s value reached $336.62. However, the current price is the result of a drop in the market witnessed a few hours back.
The value of BCH had peaked at $362.83, after which the market started pulling back and the value was facing downward pressure.
Bitcoin Cash 4-hour chart

Source: BCH/USD on TradingView
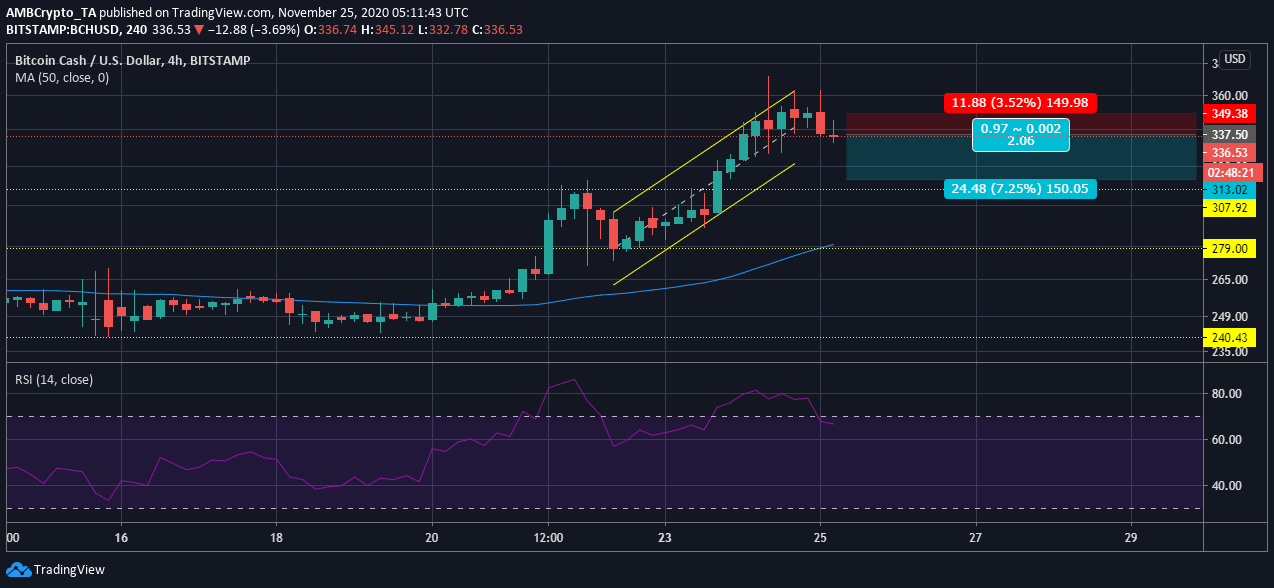
The above chart indicated the rising price of BCH over the past couple of days. This rise has been sudden and without any correction. Considering the previous price trends, the value of BCH had not surpassed above $307 since August, but given the crypto market momentum, the coin has managed to breach this level. It has been close to the value observed earlier in the year.
This rise has certainly established a bullish market for BCH, but the trend might be at a reversal point. This reversal will result in the value to drop further and providing a good short position for traders.
Reasoning
As per the Relative Strength Index, the signal has reached the overbought zone. Previously when the coin reached the overbought zone, there was a correction in the market and a similar trend is expected to take shape in the market. As the signal dropped under the overbought zone, the asset may witness some bullish pressure but will fall towards the support at $307.92 to achieve equilibrium.
Positions
Entry for Short Position: $337.50
Take Profit: $313.02
Stop Loss: $349
Risk/Reward Ratio: 2.06
Conclusion
The current price of BCH has been at a higher value and has no strong support. If the selling pressure increases the coin may drop to the $307-level, providing an opportunity to short the coin.


