Cardano short-term Price Analysis: 27 October

Although Cardano made its way into the top-10 assets yet again, competition from Bitcoin SV remains active and ADA itself continued to exhibit extreme uncertainty. Without a clear direction in the charts, ADA is struggling to manifest a clear trend in the industry. With a market cap of $3.22 billion, ADA’s value depleted by 2.07 percent over the past 24-hours.
Cardano 4-hour chart

Source: ADA/USD on Trading View
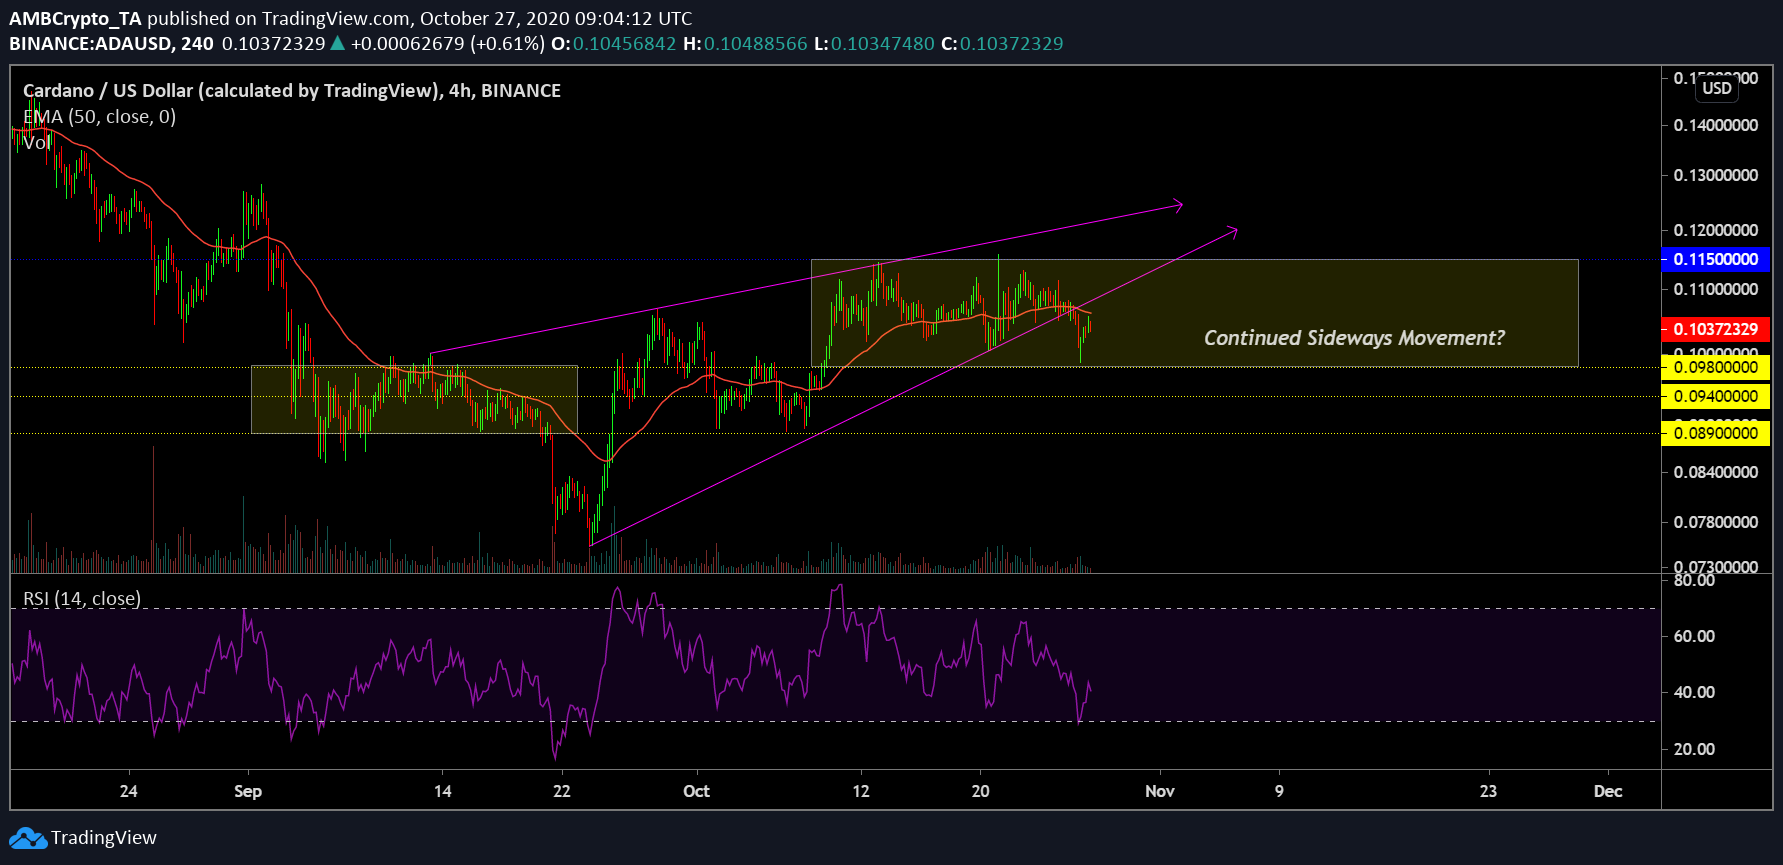
An extended period of the choppy market can be witnessed on the 4-hour chart of Cardano, as the price dwindled between being outrightly bullish or bearish. While the trend has improved a lot since September, Cardano continues to face difficulty in attaining a position above resistance at $0.115. The larger market is currently hinting towards the formation of a rising wedge in the charts, which is undergoing a breakout at press time. However, the drawdown is possibly minimal, as a bounce-back from the support of $0.098 is expected. While the 50-Moving Average thrust overhead resistance from the top, Relative Strength Index or RSI also suggested rising sell pressure.
However, rather than sliding towards an absolute bullish or bearish market, Cardano is likely to remain between the resistance $0.115 and support $0.098 for the current week.
A similar trend was observed during the early week of September which eventually exhibited a bearish move. However, the collective trend is more positive at the moment, so a short-term long position is ideal.
Cardano 1-hour chart

Source: ADA/USD on Trading View
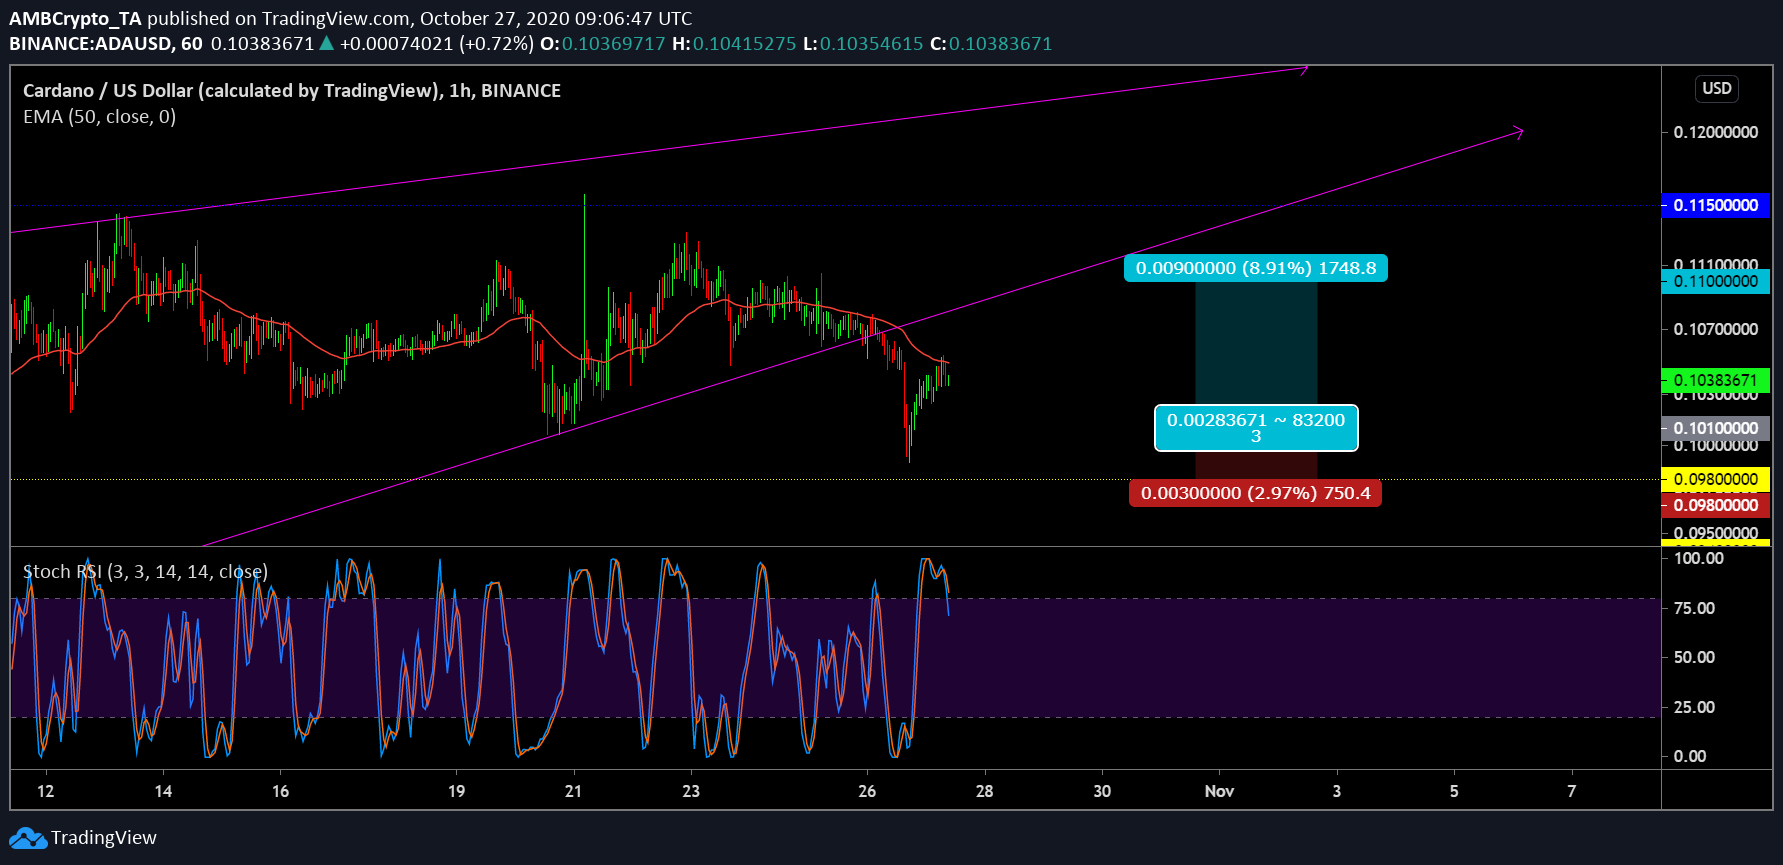
Speaking about a long position, the price-hike will possibly remain under the resistance of $0.115. Since the market is inclining towards a drop at the moment, an entry position below its current valuation should be registered.
A safe entry at $0.101 should do well for a profit-exit at $0.110. A stop-loss at $0.098 completes the Risk/Reward ratio of 3x for the trade.
Stochastic RSI indicated a verified outlook for a possible short-term drawdown as the bearish market completed a crossover in the overbought region.


