Cardano short-term Price Analysis: 17 June

Disclaimer: The conclusions of the following analysis can be foreseen to take shape over the next 24-hours.
June hasn’t been a price-friendly month for most digital assets, but the landscape has been staggeringly different for Cardano. In spite of the recent dip in the market, Cardano continued to sustain its position at a higher range, at the time of writing. The 10th ranked crypto-asset also registered its yearly-high of $0.0936 on 4 June, surpassing its previous yearly high of $0.072, a figure that was noted way back on 13 February. For comparison, none of the other crypto-assets in the top 10 have crossed their February highs.
Furthermore, the crypto-asset has also managed a 460 percent hike since 14 March, an incredible feat amidst such high market volatility. At press time, ADA tokens were valued at $0.0792.
Cardano 30-mins chart

Source: ADA/USD on TradingView
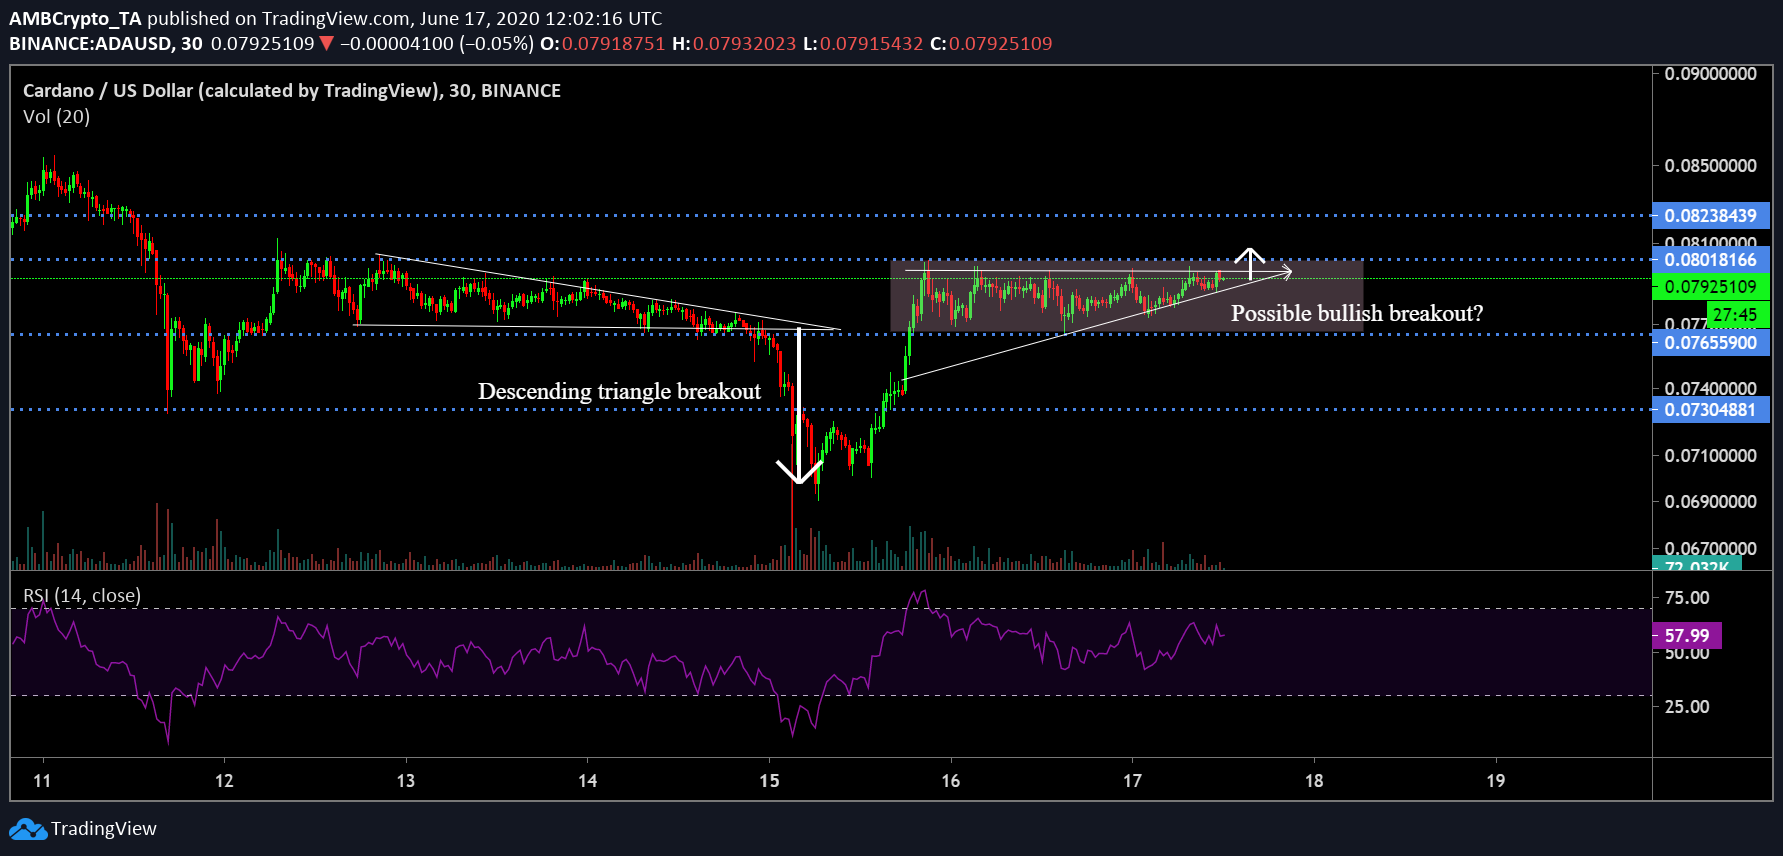
The token’s short-term chart indicated that the recent price depreciation took place after the valuation had broken out of a descending triangle pattern. The breakout pulled ADA’s price below key supports at $0.0765 and $0.0730. However, just like the rest of the market, ADA registered a quick recovery on the charts, breaching the aforementioned supports lines within a 12-hour window.
At first glance, the overall trend for Cardano seemed neutral, with the asset noting sideways movement between the resistance at $0.0801 and support $0.0765. However, the press time price movement was giving rise to an ascending triangle, one that might undergo a breakout in the next 2 hours.
A positive breakout from the pattern should allow ADA to breach above its immediate resistance at $0.0801. The possibility is low, however, since the asset hasn’t been above the mentioned range since 11 June.
Further, the Relative Strength Index or RSI saw positive buying pressure, at the time of writing, but it was unlikely to trigger a rally over the short-term.
Cardano 1-hour chart

Source: ADA/USD on TradingView
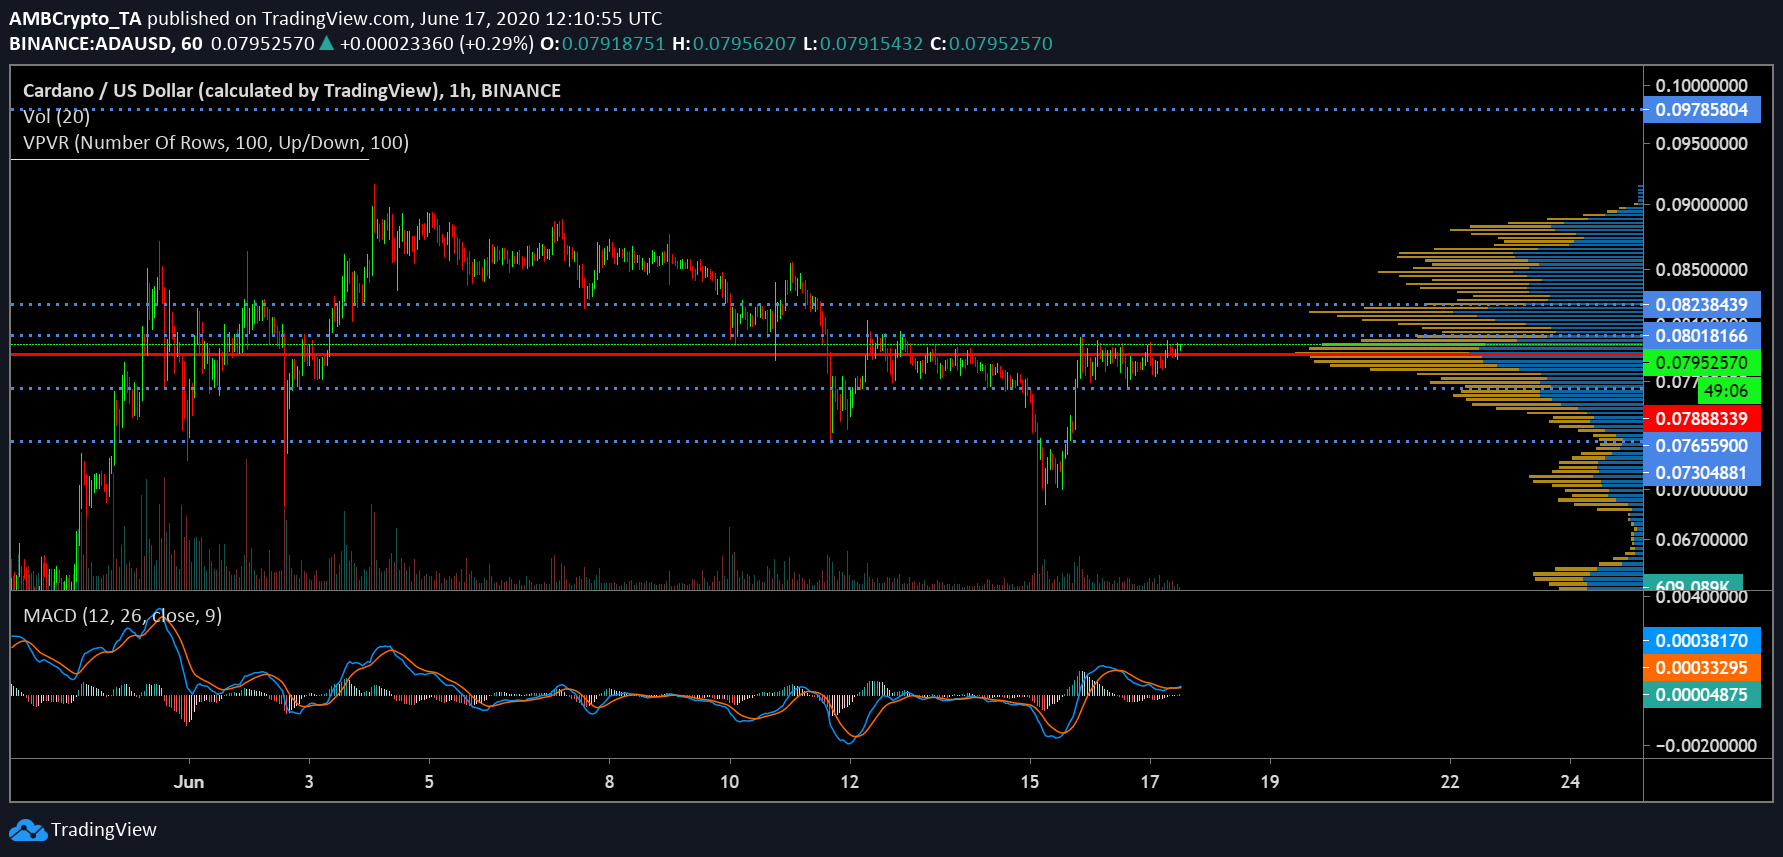
Cardano’s higher range can also be highlighted by the fact that the asset has been able to maintain a position above the Line-of-Control at $0.078. Although the current valuation is in close proximity with the Red Line, the above chart is indicative of the fact that ADA is not facing collapse, unlike other assets in the top 20.
Further, the MACD exhibited a reversal, one wherein the blue line hovered over the signal line, suggesting some bullish strength on the charts.
Conclusion
Over the next 24-hours, Cardano may breach resistance at $0.0801, but there is a higher possibility of sideways movement remaining persistent between $0.0801 and $0.0765.


