BTC might see a short-term loss while ETC, Link continue their bull run

Bitcoin, with the start of April, has seen a massive uptrend in its price. The coin breached major supports and managed to cross the $7,500 level. Similarly, altcoins like Ethereum Classic and ChainLink have also recorded a significant amount of growth since the start of April.
Bitcoin

Source: Bitcoin/USD, TradingView
After the wild price run experienced in March, the top coin saw an increase of 7% at the start of April and since then, the coin has not breached the support at $6619. The coin saw another 8% increase on April 6 and found support at $6769. As seen in the attached chart, the rising wedge pattern formed hints at a downward breakout in the near future. If that’s the case, the price might fall back to $7,500 level. CMF indicator which rests at -0.03 also indicates a short-term downward breakout.
Resistance: $7543.52, $7775.33
Support: $6768.83, $6619.95, $6202.76
Press time price: $7734.88
Market Cap: $142,310,137,111
24-hour Trading Volume: $35,647,602,062
Ethereum Classic

Source: ETC/USD, TradingView
Ethereum Classic, the 21st coin on Coinmarketcap, has been quite stable in terms of price when compared to other altcoins. Post the market crash on March 12, the coin’s price has seen the above chart, has not seen many fluctuations. After rising by 43% on March 13, it held support at $4.54. Awesome Oscillator indicator indicated a continued bull run while the widening Bollinger Bands indicate high volatility in the coming days.
Resistance: $7.03, $9.90, $12.44
Support: $4.54, $3.72
Press time price: $6.15
Market Cap: $717,911,473
24-hour Trading Volume: $2,350,774,160
ChianLink

Source: Link/USD, TradingView
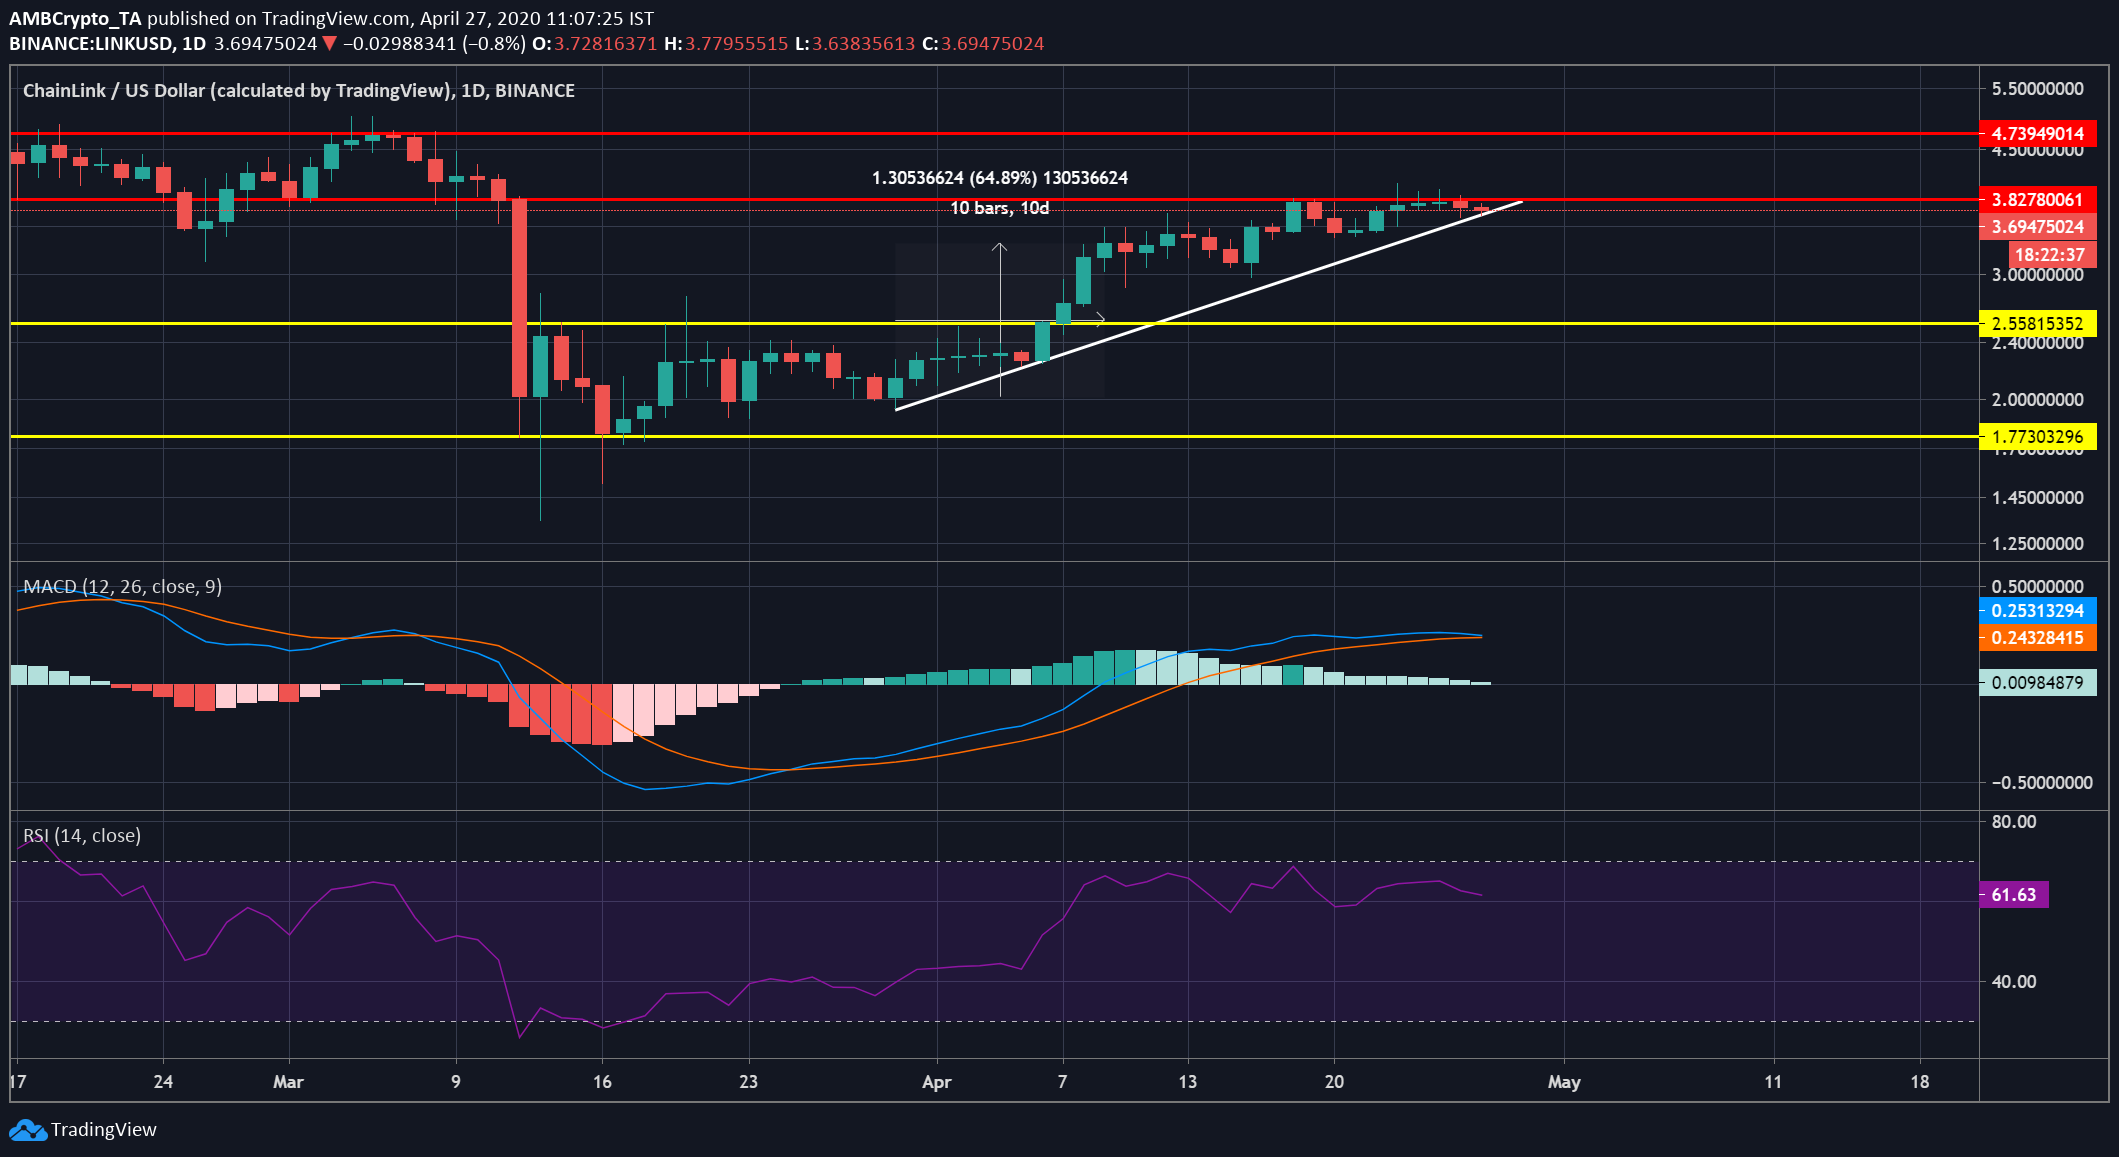
Link, with a current circulating supply of 350,000,000 LINK, has been maintaining the 11th position on the chart. The coin started an upward run towards the end of April and has been on a bull run since then; the coin saw a rise by 64% in a period of 10 days. MACD indicator hints at a potential bullish crossover indicating a continued bull run and RSI indicator signals a potential ‘over-sold’ situation soon.
Resistance: $3.82, $4.73
Support: $2.55, $1.77
Press time price: $3.69
Market Cap: $1,296,560,950
24-Trading Volume: $379,556,090


