Analysis
XRP’s climb might be temporary as it nears breach of ascending channel
XRP’s journey in the cryptocurrency market has been challenging in 2019, with the price being restricted between $0.25 and $0.23. The coin noted a surge in its price on various instances; however, it simultaneously fell, negating the growth. At press time, the third-largest coin stabilized at $0.2955 with a market cap of $12.82 billion.
However, XRP’s long term chart painted a bearish picture leading to a fall in the coin’s price.
Daily

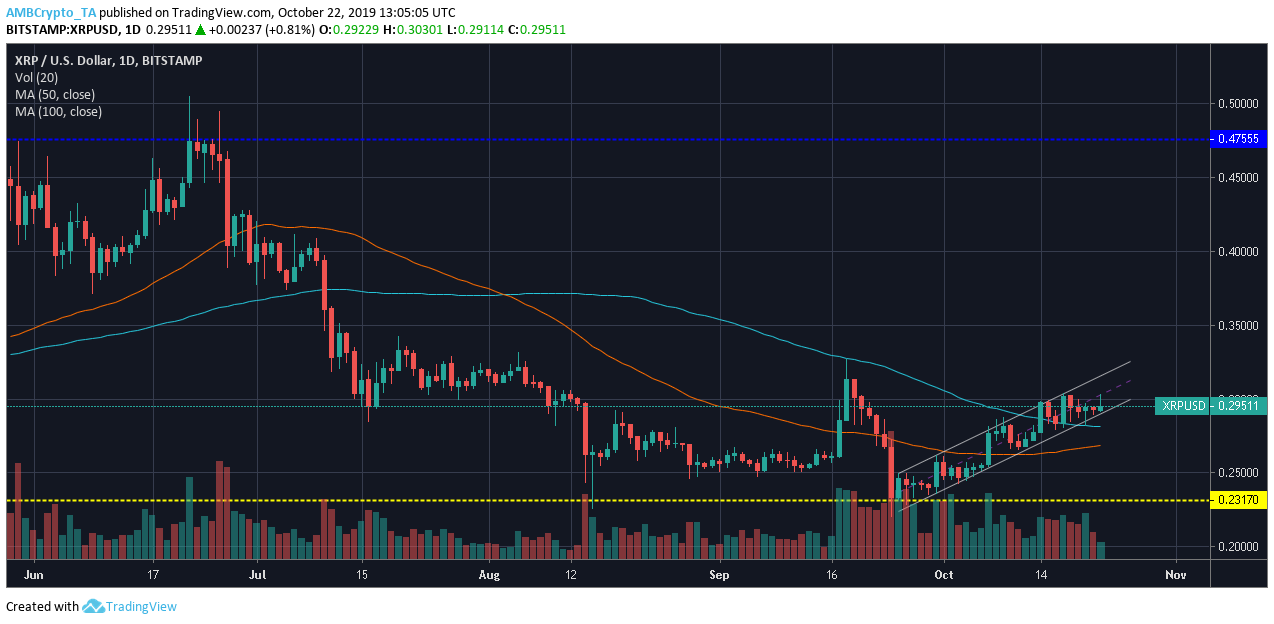
Source: XRP/USD on TradingView
The daily chart of XRP suggested an ascending channel making its way in the XRP market. Conceived as a bearish indication, ascending channel connected higher hight at $0.2504, $0.2615, $0.2843, and $0.3034 and higher lows at $0.2368, $0.2530, and $0.2843. The price of the coin has climbed up by 15.52% within the channel and its breach might result in the dropping price, which might be closer to the immediate support.
100 moving average dominated 50 moving average for the 79th day. However, the averages were under the candlesticks, indicating a minimal bearish momentum in the market.

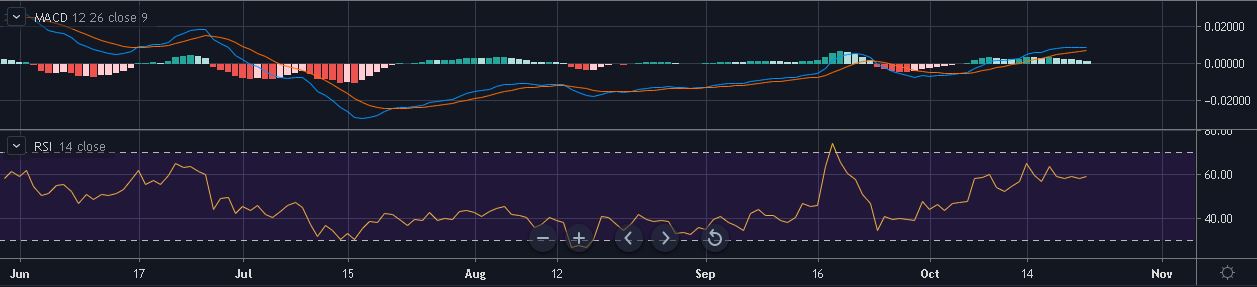
Source: XRP/USD on TradingView
MACD indicator pointed toward the buoyant XRP market, with MACD line taking over the signal line and suggesting a strong bullish momentum. Relative Strength Index [RSI] noted the signal line approaching the overbought zone pointing at the growing interest of the buyers, marking a bullish market.
Bulls Vs Bears
XRP market indicated a strong bullish presence in the market, at press time. However, this bullish trend in the market may reverse as the coin breaches the ascending channel and test its immediate support.


