Analysis
XRP’s bull flag pattern could hoist price high

XRP’s price was hovering between the $0.21-$0.25 range for a long time now. A much-needed breakout to the positive side could be in the offing as XRP bulls take position to take over. The coin was trading at $0.23 after a surge by 2.14% over the last 24-hours, at press time. Additionally, according to data on CoinMarketCap, XRP registered a market cap of $9.99 billion and a 24-hour trading volume of $1.04 billion.
XRP 1-Hour Chart:

Source: XRP/USD on TradingView
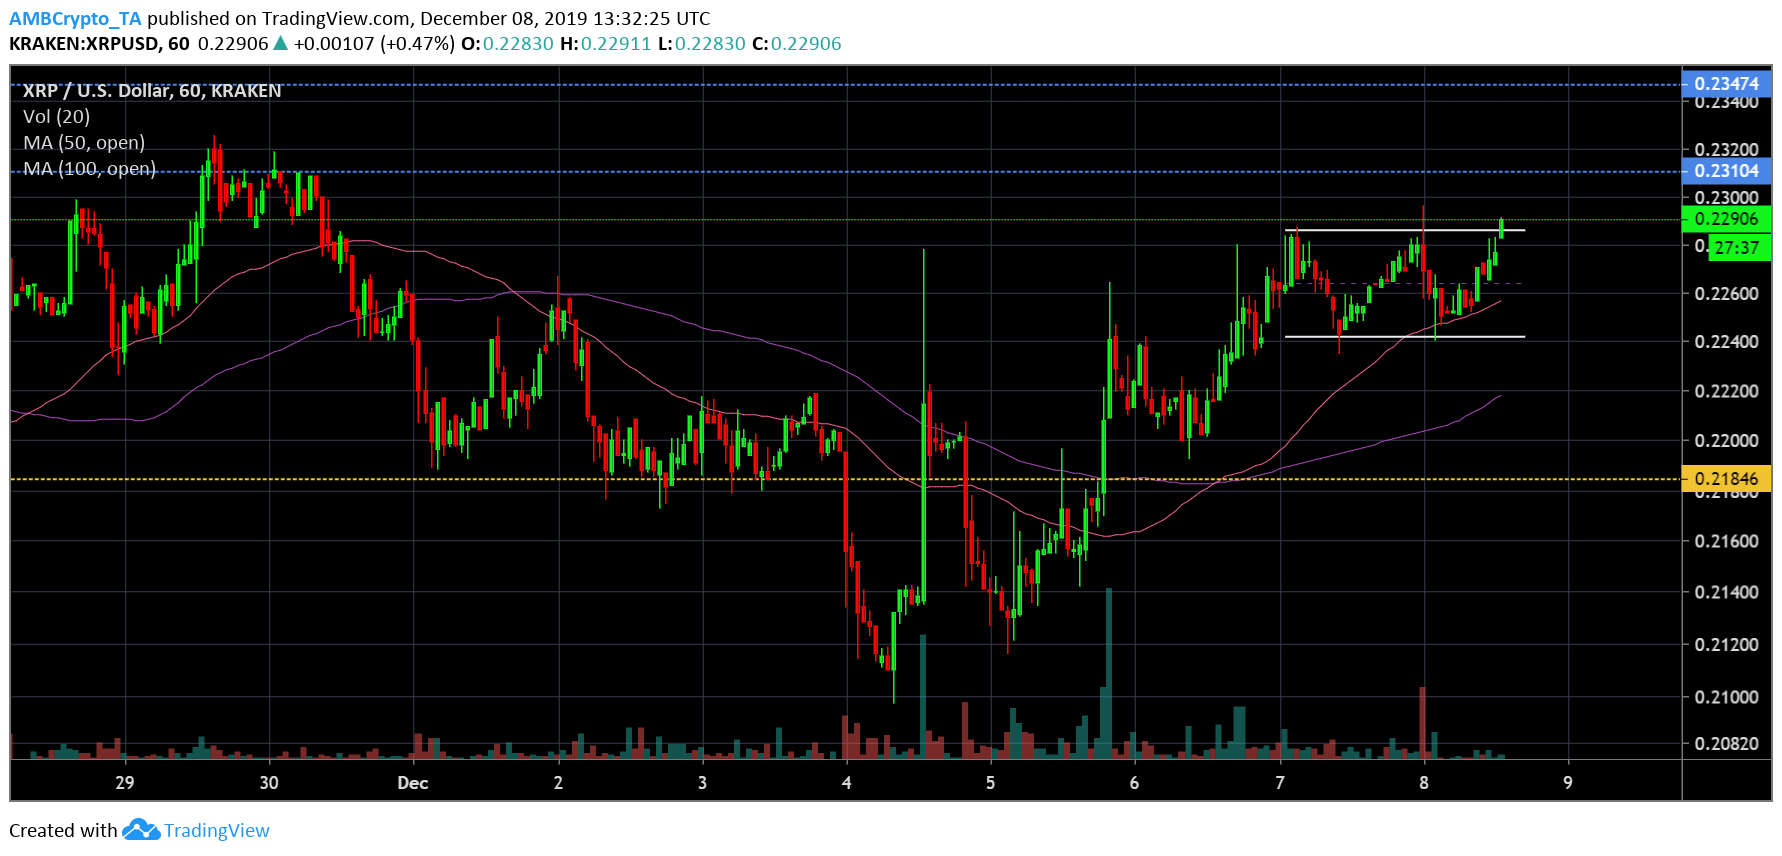
XRP’s daily chart exhibited the formation of a bull flag pattern with the price rising high and oscillating between two parallel horizontal lines. This was indicative of a potential bullish price breakout in the near-term.
The moving averages also sided with the bulls. 50 moving average was above the 100 moving average, after undergoing a bullish crossover on Dec 5th. This indicated a positive sentiment for the coin’s price. Additionally, both the moving averages were well below the price candles. This strongly projected bullishness for the digital coin’s price in the near-term.
An upside breakout would drive the XRP bulls to breach its immediate resistance at $0.234. A stronger upward pull could lead the coin to hit close to $0.24. XRP found support at $0.21.
Bullish projection
Source: XRP/USD on TradingView
MACD underwent a bullish crossover at press time, following which the signal line slid below the leading line. Further, RSI indicated a significant spike well above the 50 median and the coin’s price was in the overbought zone.
Conclusion:
The above chart predicted a strong bullish phase for the coin. A positive breakout would drive the coin to $0.24, a level unseen since November 22nd.

