XRP’s breach of symmetrical triangle likely to boost short-term price

XRP’s price has witnessed substantial volatility; over the past two weeks, XRP’s price slumped on various occasions but the valuation managed to exhibit a minor hike.
1-hour chart

Source: Trading View
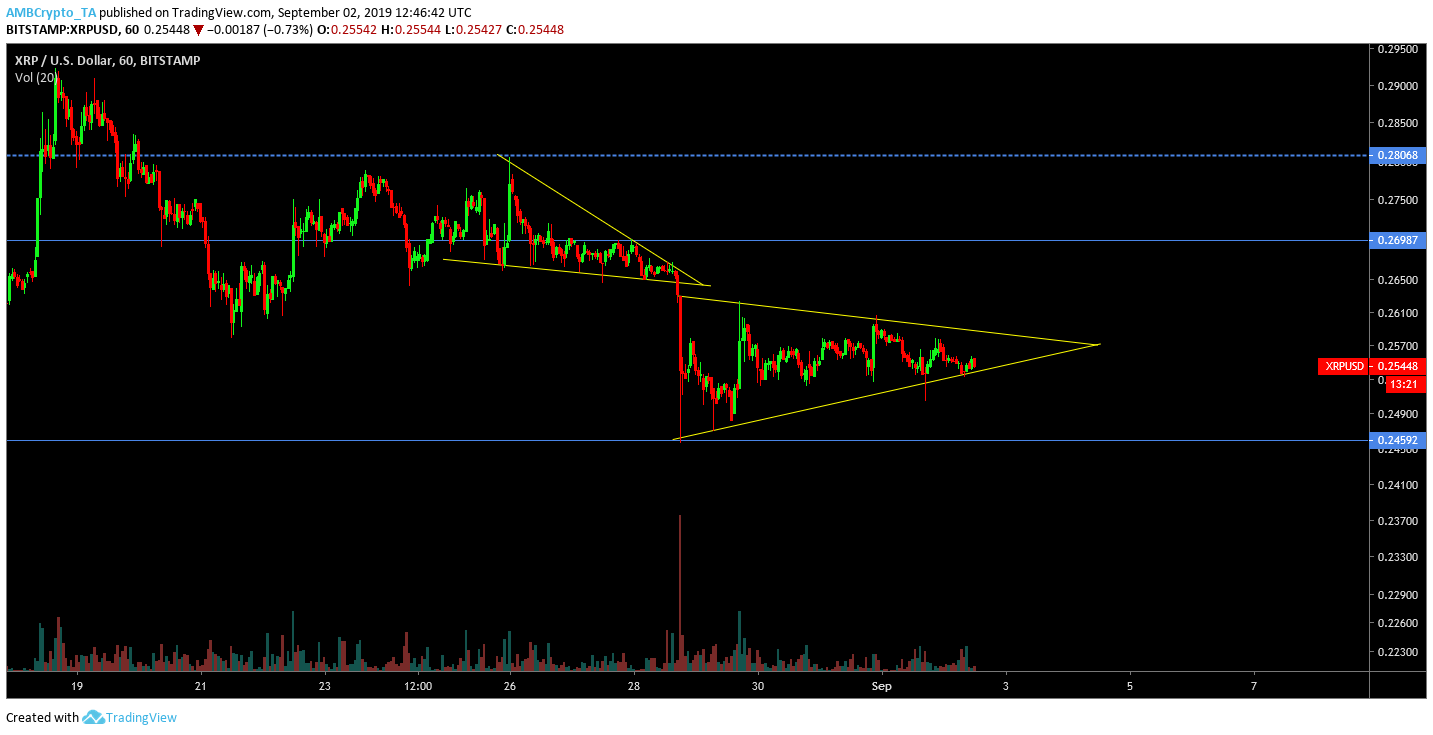
In the 1-hour chart, it can be observed that the coin’s movement adhered to a falling wedge pattern before a bearish breakout unfolded. Generally, a falling wedge pattern is followed by a bullish breakout hence the breakout is yet to surface in the charts.
At press time, XRP’s price was complying with the formation of a symmetrical triangle pattern, indicating another imminent breakout. In the case of a symmetrical triangle, the breakout has an equal chance of transpiring on either side of the spectrum. The trade volume of the coin had also reduced over time, indicating absence of active investors in the market.
4-hour chart

Source: Trading View
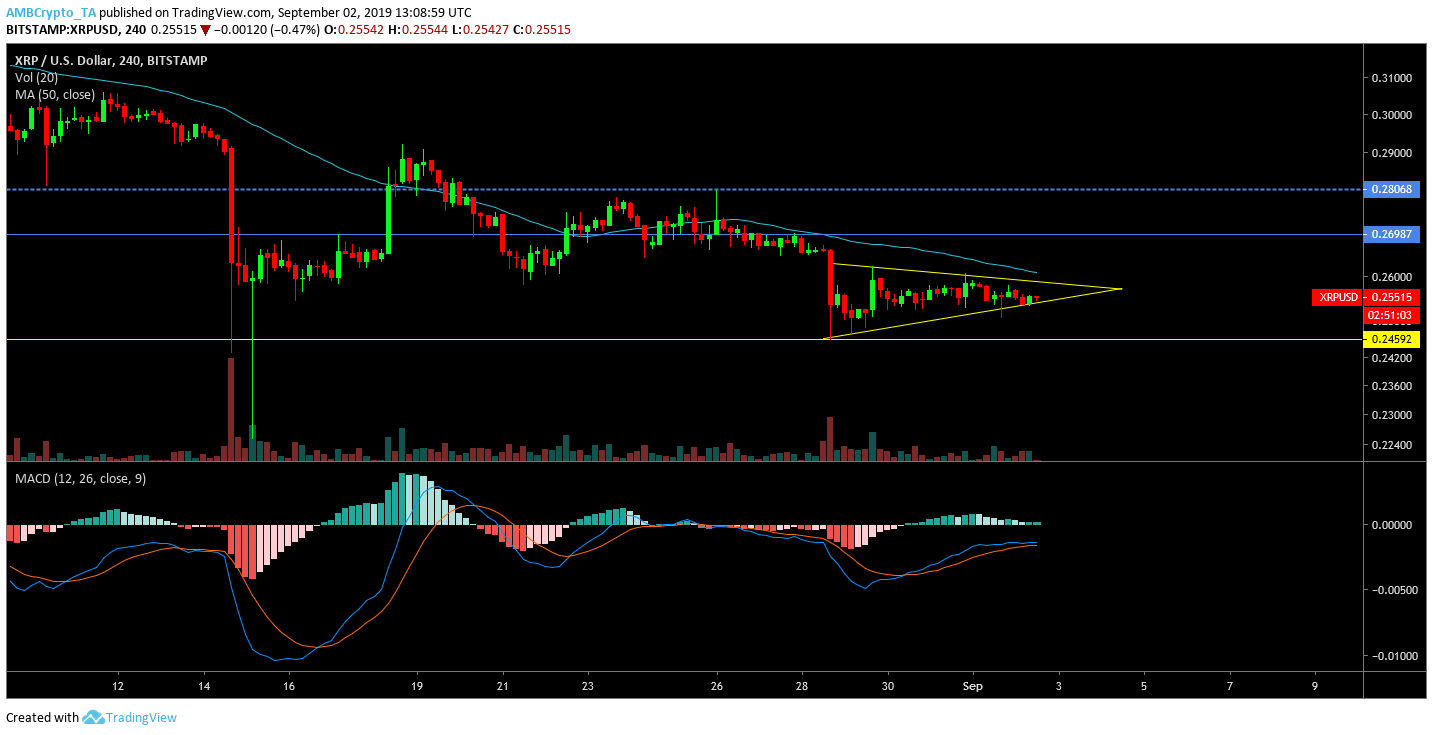
The 4-hour chart indicated the formation of a similar pattern at press time. Another breakout is on the cards for XRP and a bearish breakout could see XRP retest support at $0.2459.
However, a bullish breakout could be a welcoming sight for the third-largest asset, as it could potentially allow XRP to test the resistance at $0.269 in the next few days. The MACD indicator was bullish in nature at the time of writing, which signalled the possibility of a bullish breakout.
Conclusion
The formation of a symmetrical triangle in the short term chart can have potential upside for XRP’s price however, another bearish breakout could trigger another major bearish run for the asset.
