Analysis
XRP’s breach of descending triangle followed by an unexpected spike
XRP has been failing to recover since it fell by 14.20% on 7 November. The coin’s value slipped to $0.2703, following which it continued its descent. The third-largest coin, at press time, was valued at $0.2143, with a market cap of $131.6 billion and a 24-hour trading volume of $16.04 billion.
XRP’s price breached another bearish pattern that has resulted in the value of the coin falling further.
XRP Hourly Chart

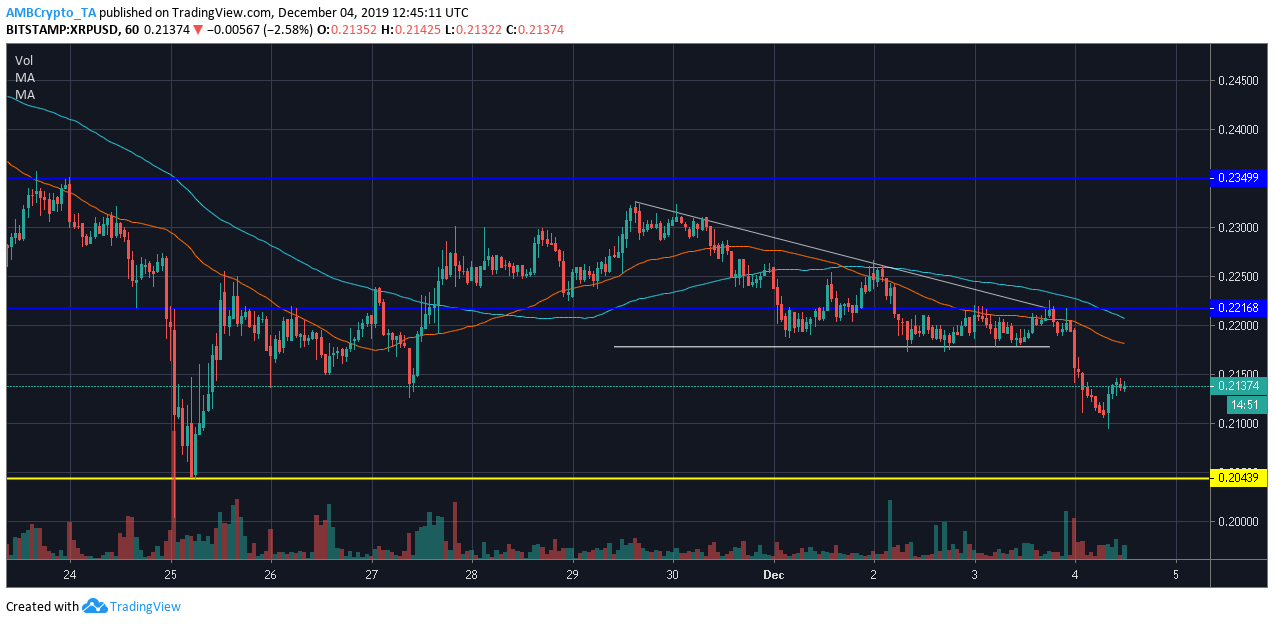
Source: XRP/USD on TradingView
The hourly chart for XRP denoted the formation of a descending triangle, a bearish pattern. The pattern marked the lower highs of the coin at $0.2324, $0.2308, $0.2263, and $0.2215 and the base of the triangle was established at $0.2177. The coin rallied within the triangle till it noted a major breach from $0.2205 to $0.2106, a fall of 4.50%.
The 50-day MA crossed over the 100-day MA over two days ago, marking a bearish market. The placement of the averages above the candlesticks reflected extreme bearishness in the market. However, at press time, XRP shot up by 5.85% to $0.2256.

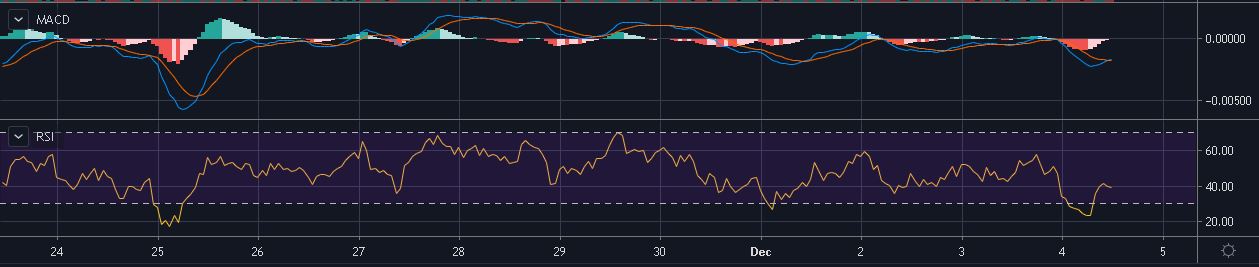
Source: XRP/USD on TradingView
The MACD indicator suggested that the MACD line and the signal line were at a junction of crossover, but the bearish trend appeared to take precedence. On the other hand, the Relative Strength Index [RSI] pointed towards the oversold zone, noting the presence of the bearish trend.
Conclusion
The third-largest coin, XRP, broke out of the descending triangle pattern and suffered a drop in its price. However, the price of the coin surged following a surge in the price of Bitcoin, which placed the price of the coin at $0.2207.


