
A look at the price movement chart for XRP since its inception showed little price action over the last year. 2019 saw a yearly high of around $0.50, a dismal price-tag compared to 2018’s high of $3.31.
It had breached under the $0.20 mark earlier this month and has had some trouble recovering from the drop, valued at around $0.19 at the time of writing. XRP exhibited little signs of hope, though things could change as the coin in the long term.
XRP 1-day chart
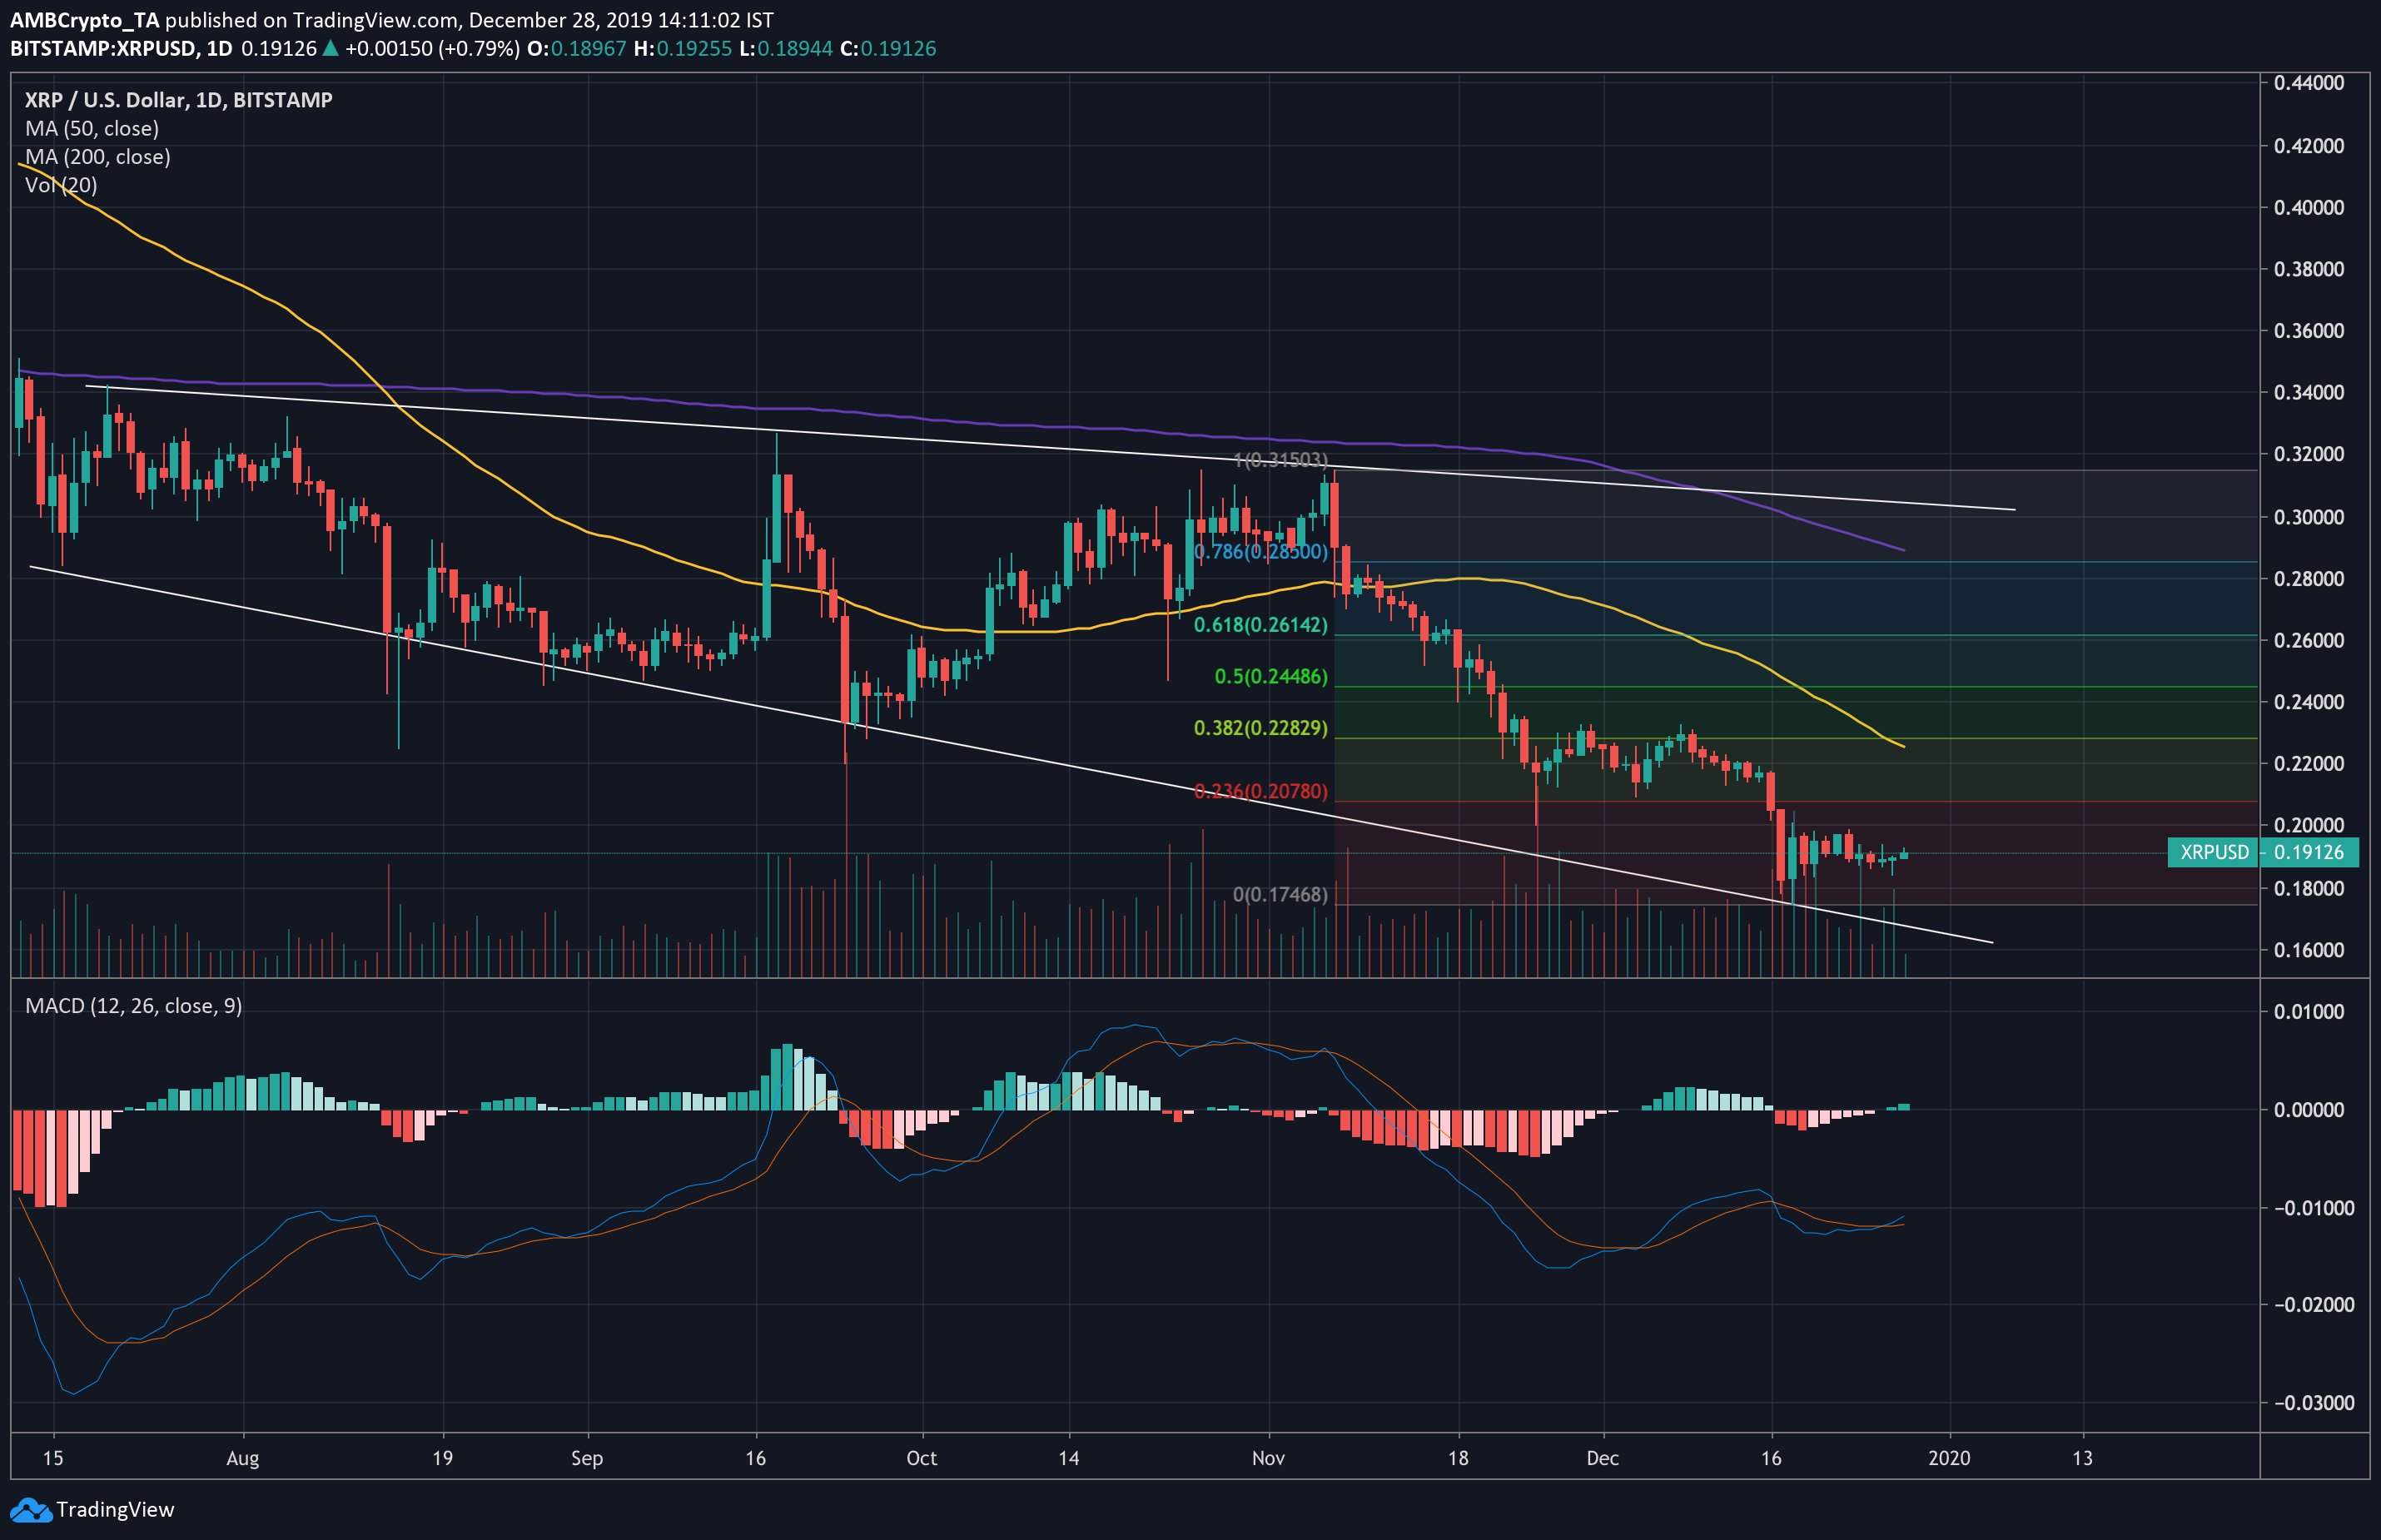
Source: XRPUSD on TradingView
After a near 44% drop in value, from $0.50 to $0.28 in the month since mid-June, XRP looks to have entered a descending broadening wedge formation, accompanied by an upward trend in volume, as expected. These patterns tend to act as a reversal of the prevailing price trend, indicating an upward-facing breakout in the coming weeks.
The 50 and 200-day moving averages were indicative of a bearish market, with both lines moving far above the price line. Recent dips in the coin’s price have caused the MAs to dip downwards toward the end, opening an opportunity for XRP to climb above them.
MACD reported a bullish scenario, with the MACD line having crossed over the signal line just days ago, though the price has not made any dramatic movements since. The next key level of resistance, should XRP go up, would be at the $0.20 mark, just under the 23.6% Fibonacci retracement line.
Assuming it continues moving up through the pattern till breakout, XRP is also likely to face considerable resistance from the 50-day MA before being able to rise above $0.218, and a bounce back from this level could prolong the coin’s residence within the pattern.
XRP Volatility
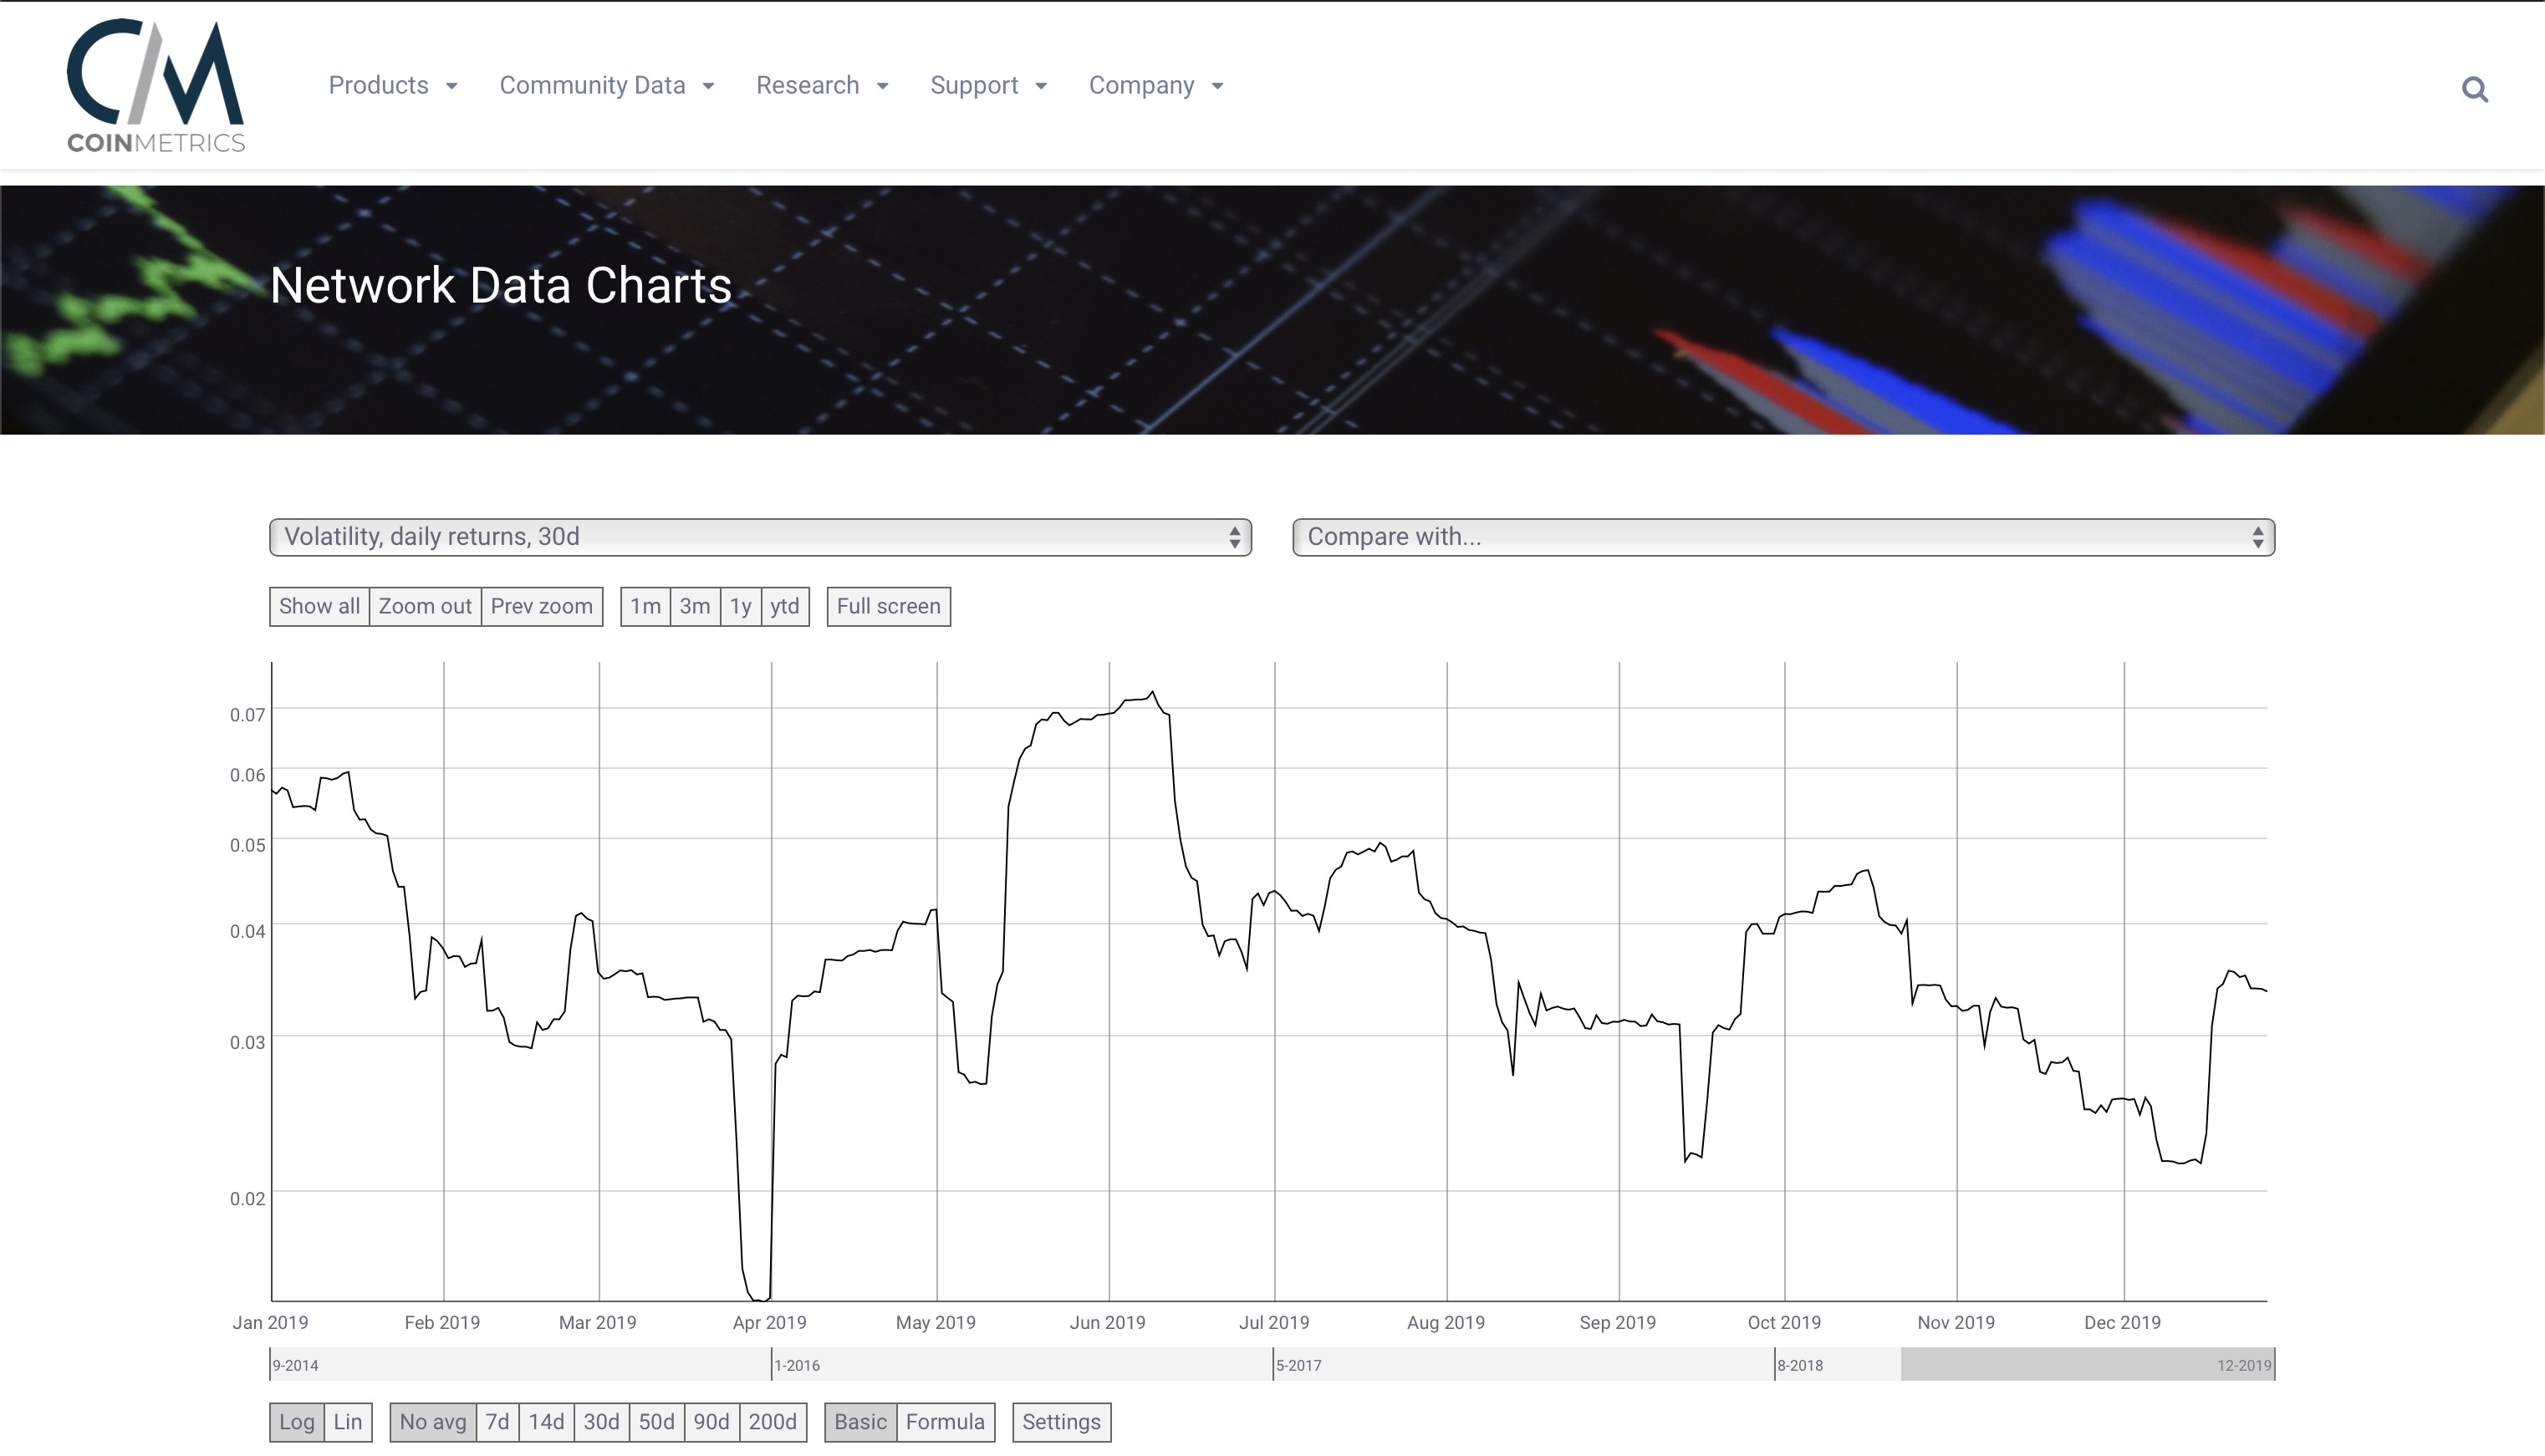
Source: CoinMetrics
According to CoinMetrics’ data, XRP volatility (based on 30d returns) was at its highest point since mid-October, and looked to be stabilizing, implying that considerable price swings could be in store for the coin.
The most recent rise in volatility sparked a drop in value from $0.22 to just under $0.19. Maintaining that level of volatility, a corrective movement doesn’t seem unlikely. Further, Bitcoin is also likely to rise in January, and its correlation with XRP is moderately high, at the time of writing.
Conclusion
A corrective movement could see XRP price testing the 38.2% Fibonacci retracement line ($0.228) by the first week of January, and the time scale at which the pattern is forming makes the move above $0.30 before March quite unlikely.
However, if the coin’s volatility were to rise up to, say, mid-June levels, a swing in price up to the breakout point looks feasible. Further, an eventual upward breakout could push XRP, theoretically, to above $0.436. However, volatility works both ways, and could just as well see the price tumble beneath its recent lows.