
Bitcoin’s price, at the time of writing, continued to remain close to the much-anticipated $16K-level. Owing to their high correlation to the world’s largest cryptocurrency, many of the market’s altcoins benefited as expected. In fact, popular altcoins like XRP, Synthetix, and NEM saw their prices surge over the past week. However, over the last 24-48 hours, these surges had given way to periods of consolidation.
XRP
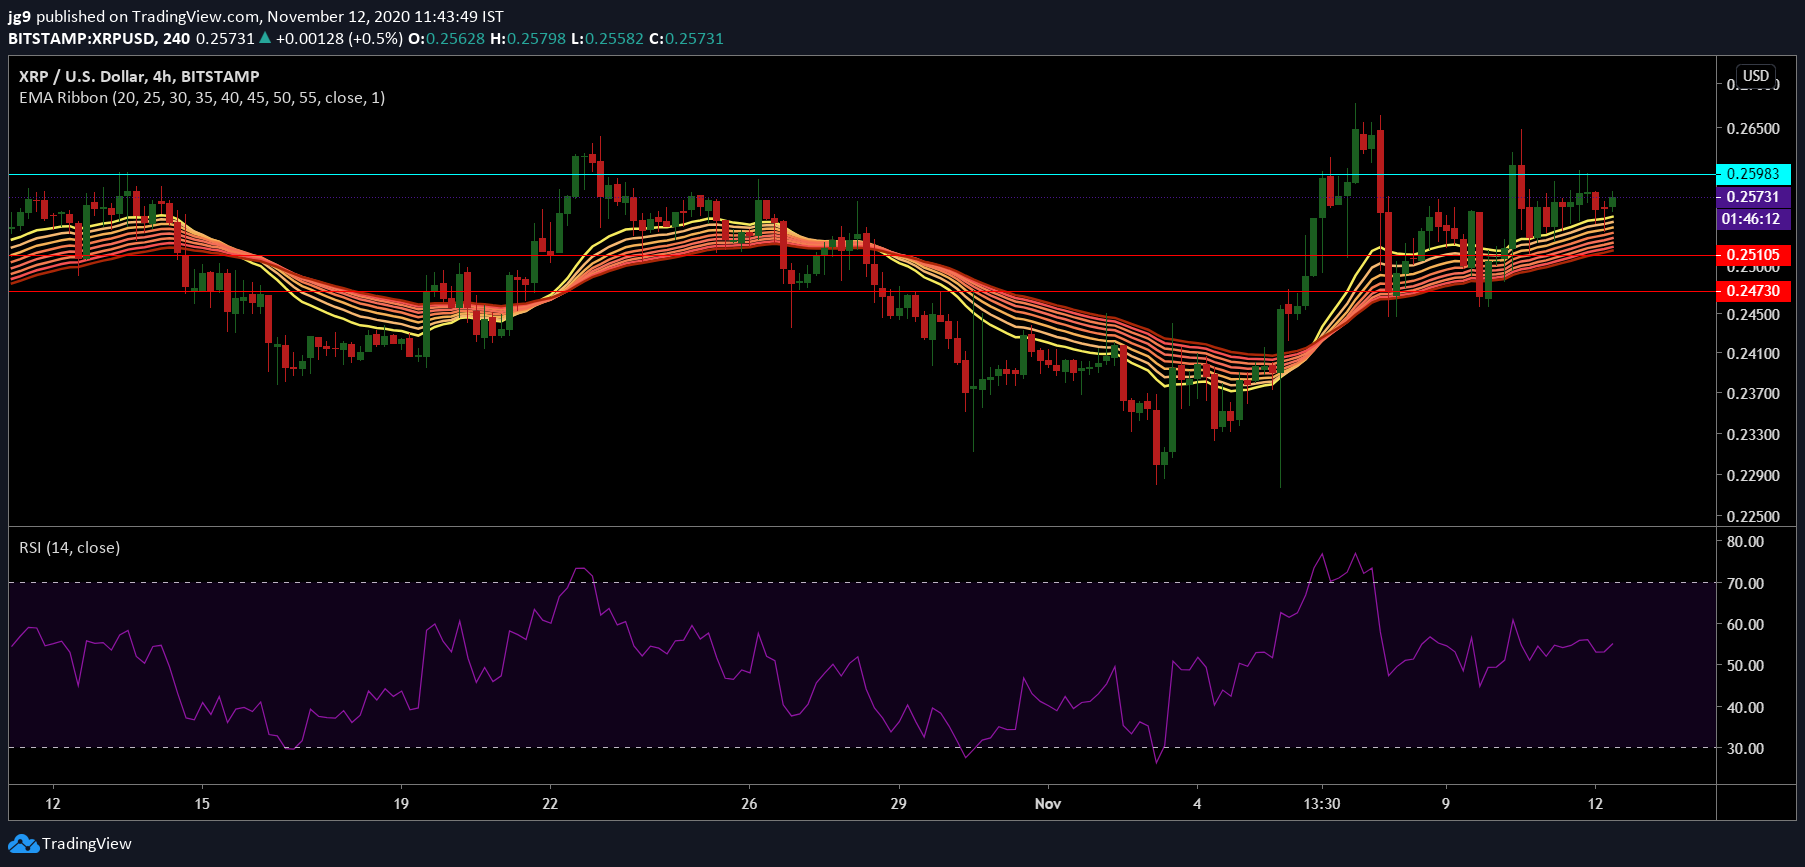
Source: XRP/USD, TradingView
XRP, at press time, was trading at $0.256, with the alt continuing to hold the fourth spot on CoinMarketCap’s list with a market capitalization of over $11 billion. While the coin did surge significantly on 5 November, the following period saw the coin move mostly sideways between the $0.247 and $0.259 price levels. It must be noted, however, that these price points also happened to be key support and resistance levels.
The EMA ribbons had settled below the press time trading price and were offering support to XRP, with the crypto likely to move even closer to its immediate resistance level. The RSI concurred with the trajectory projected by the EMA ribbons as it was heading towards the overbought zone.
XRP was recently in the news after Ripple, according to its market report, bought nearly $46 million worth of XRP in the third quarter.
Synthetix [SNX]
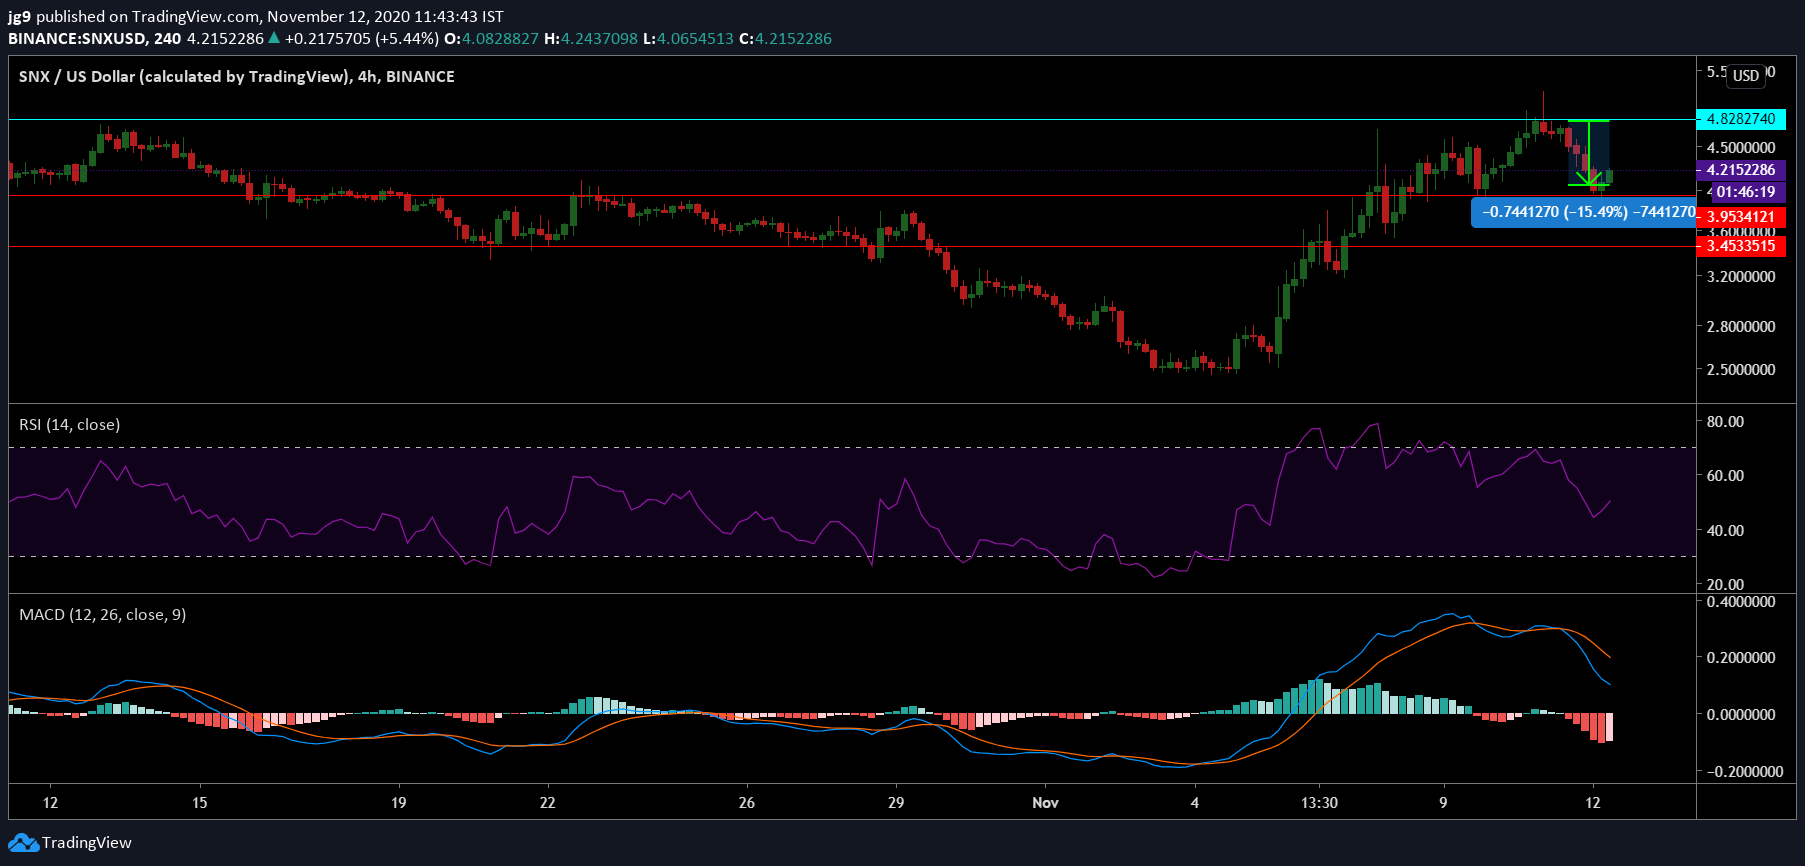
Source: SNX/USD, TradingView
Synthetix’s price has risen significantly over the course of the week. However, in the short-term, the cryptocurrency did note a correction with a drop of over 15 percent. At press time, SNX was being traded at $4.1 with a market cap of $432 million. The press time price of the coin was quite close to the support level at $3.9 and if the coin were to head north once again, there will be a significant resistance level at $4.8.
The RSI indicator continued to remain around the neutral zone, but it was making its way up to the overbought zone. However, the MACD indicator showed a bit of divergence as the signal line continued to remain above the MACD line, maintaining the bearish crossover.
NEM [XEM]
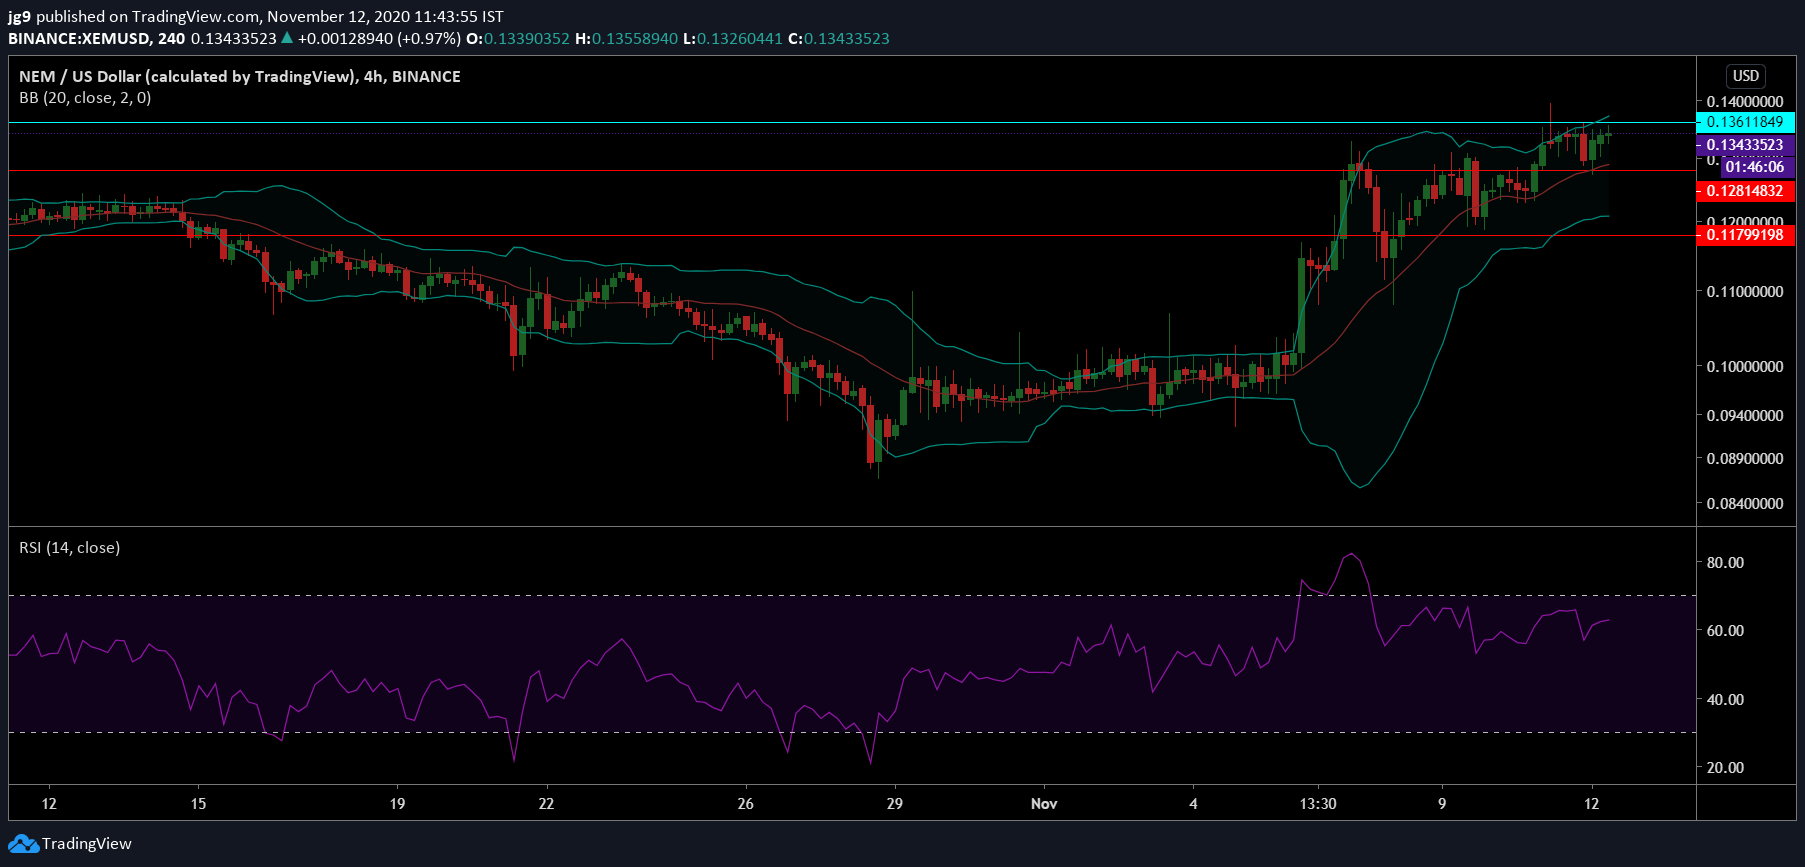
Source: XEM/USD, TradingView
NEM saw its price rise by over 34 percent over the past week. At press time, the coin was being traded at $0.134 with a market cap of $1.2 billion. Akin to many other altcoins, the latest 24-hour timeframe saw mostly sideways movement for the coin, with NEM remaining between the support at $0.128 and resistance at $0.136.
Further, the Bollinger Bands were contracting a tad, signaling a fall in volatility for the coin’s price. The RSI indicator, on the other hand, continued to remain close to the overbought zone and may be quite helpful for the coin’s price.