XRP price takes a hit as coin breaches out of descending triangle pattern in short term

Despite the boost in its price, XRP failed to hold the price above $0.30 and slipped back to its bearish price zone. Short term charts of the coin suggested a breach of bearish pattern, after which its price stood at $0.2791, at press time.
1-hour

Source: Trading view
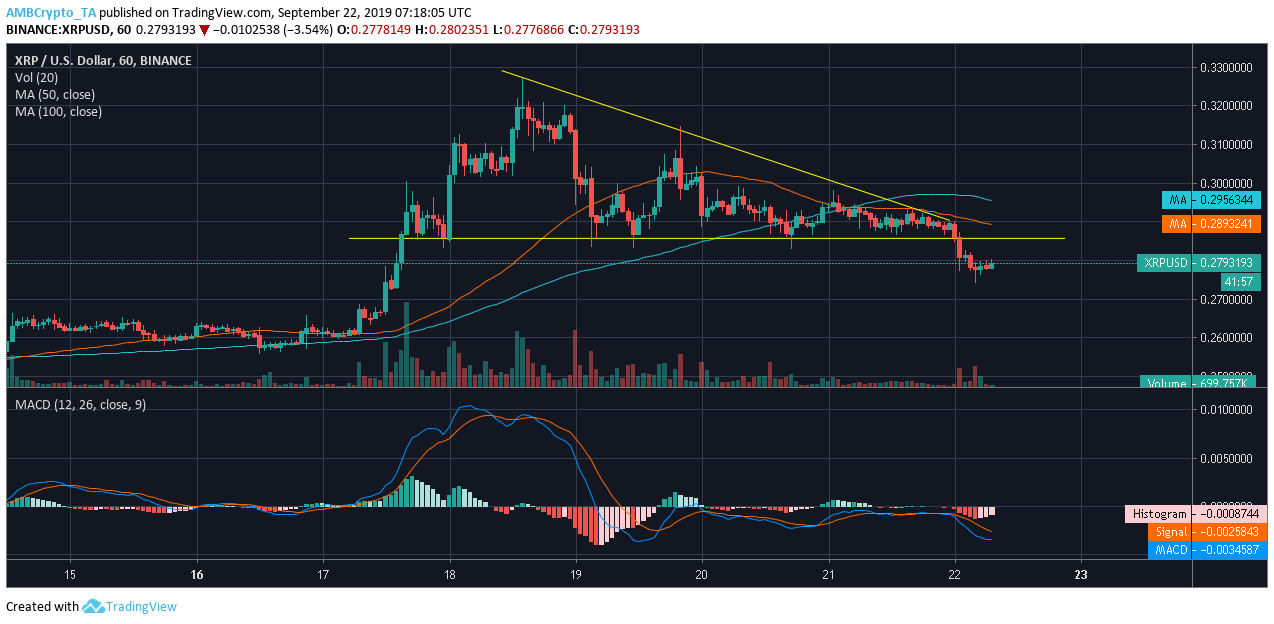
XRP’s 1-hour chart revealed the formation of a descending triangle pattern. The pattern characterized by a sloping trend line connecting the lower highs at $0.3269, $0.2934, and $0.2904, while another horizontal line acted as support at $0.2857. As the price consolidated within the triangle, the volume too consolidated over time and finally saw a bearish breakdown of 5.61% within hours.
50 moving average affirmed bears’ presence in the market as it rested under the 100 moving average, while MACD line too laid below the signal line.
4-hour

Source: Trading view
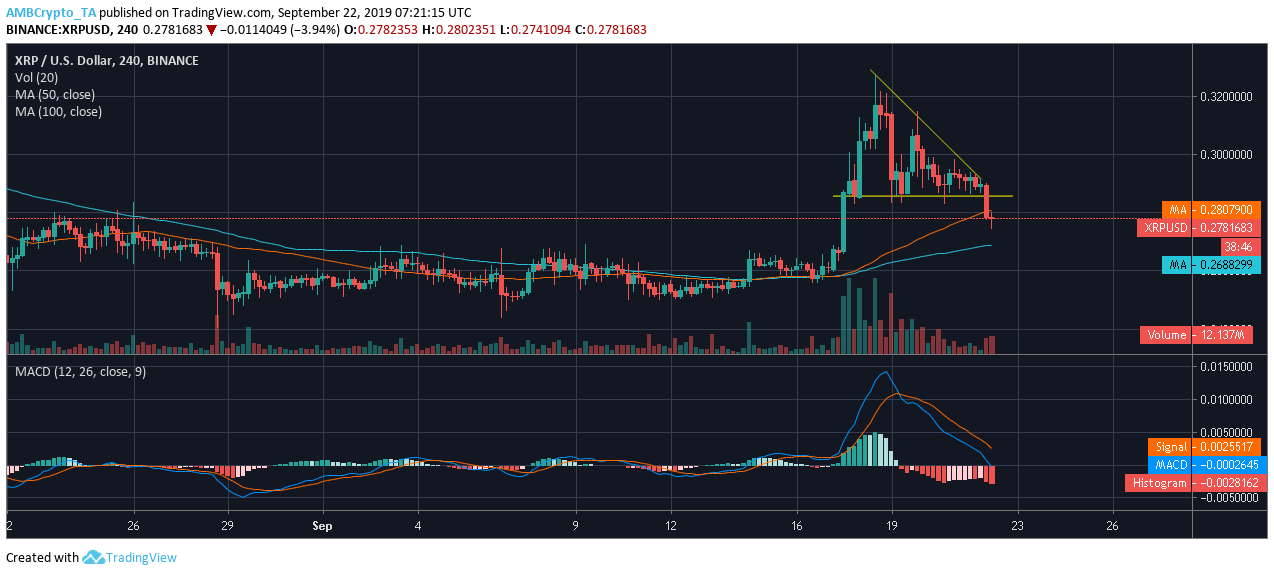
4-hour chart of XRP too reported a breach in the descending triangle. The lower highs are marked at $0.3268, $0.2931, and $0.2896 and the base of the triangle was formed at $0.2862. The fall of the coin was reported to be 5.50% as the volume resonated with the declining price.
Despite a bearish reign, 50 moving average was above 100 moving average indicating a bullish wave. However, MACD line was under the signal line, re-affirming the bearish trend.
Conclusion
XRP’s price has already taken a hit as it breached the descending triangle pattern in the short term. The price may normalize over time, but the price of the token for the most part of the year has been restricted within $0.2700 and $2500 range and might return to it.


